Real-Time Stock Valuation with Cogynt
Note
This article does not offer financial or investment advice. It is intended as a notional example of how one might do financial analysis using Cogynt's modeling capabilities.
Rapid changes in the market make stock analysis feel overwhelming, unless we understand more about the stock's intrinsic value. When we understand more about a company's financials, other market data (such as shifts in trends or consumer attitudes) is easier to contextualize.
The following is our comprehensive model delving deeply into a company's records, and offers several unique competitive advantages to existing solutions:
- A no-code visual approach to creating mathematic calculations.
- The ability to process millions of data points in real-time from multiple sources.
- Custom tailored models adjusted to fit any risk profile.
- Constant risk-based analysis from real-time ticker data.
- Output to Cogynt Workstation, Grafana, and other visualization tools.
Note
This model uses Bayesian risk, such that:
- IF 1 THEN Confidence = 20%
- IF 3 THEN Confidence = 60%
- IF 5 THEN Confidence = 100%
Thus, a risk score of 80 can be interpreted as "meets 4 of the 5 criteria."
This use case outlines the approaches we took along the way. We encourage you to try this model for yourself and make adjustments that best suit your organization and level of risk.
Preparing Model Input Data
The stock analysis in Cogynt Authoring relies on six input topics, and uses computations built in Authoring to publish outcomes for these topics with Flink.
Note
- All fields except the ticker are scraped from company's income statement.
- All topics contain the stock's ticker symbol.
Six input topics exist:
live_dataincludes the live price and a datetime (timestamp) of the live price. We used the Yahoo! Finance API to scrape this data.market_dataincludesaaa_yieldscraped fromhttps://fred.stlouisfed.org/series/BAMLC0A1CAAAEYusing BeautifulSoup, andsp_avg_return(calculated in Jupyter notebook by averaging all the returns of S&P 500 index).income_statementincludes basic EPS, trailing twelve months earnings per share (TTM EPS), net income available to common shareholders,interest_expense, annual revenue, and tax rate.balance_sheetincludes shares outstanding (calculated in Jupyter notebook usingmarket_cap/live price of the stock), beginning debt, ending debt, cash and equivalent.cash_flow_statementincludes the free cash flow amount reported on the most recent 10k, dividends paid, and free cash flows for the next five years. We calculated future cash flows for the next five years in Jupyter notebook with the following:- Calculate the average growth rate of free cash flows of the past 5 years.
- To account for future uncertainty and be conservative, multiply the average growth rate by 0.75.
- Use the conservative growth rate (0.75 * average growth rate) to calculate the future free cash flows for the next five years using the following formula:
next_value = last_value * (1 + growth_rate).
company_profileincludes different company details, such as name, address,market_cap, current dividend, analyst estimated five-year growth rate, company beta (company risk relative to the market), industry, sector, dividend average growth rate (calculated in Jupyter notebook using the previous year’s dividend info), dividend yield, etc. These items were scraped or calculated based on data from Yahoo! Finance.
Outlining the Five Stock Analysis Methods
This model involves multiple methods, each a valid stock analysis formula in common usage.
Method One: Price/Earnings Growth Ratio
PEG (Price/Earnings to Growth Ratio): PEG is an alternative to P/E ratio, and it's used to determine a stock's value while taking into consideration the company's expected growth. Since PEG factors in the expected Growth Rate (PEG = (P/E)/EPS growth), it could be considered a more complete picture than a standard P/E ratio.
Note
- P/E is a separate pattern calculated using EPS and the live price of a stock. EPS itself is calculated using Net Common Income (taken from the company's Income Statement) and outstanding shares (taken from the balance sheet).
- EPS Growth rate is an estimate, and we used Yahoo! Finance's 5 year estimate (one of the fields in Company Profile topic).
If the result is between 0 and 1, then the stock is undervalued. Otherwise, it is overvalued.
Method Two: Lynch Ratio
The Lynch Ratio was created by Peter Lynch and is the dividend adjusted PEG ratio. The formula looks like this:
Lynch Ratio = Price/Earnings / (earnings growth + Dividend Yield)
The Lynch Ratio is very similar to the PEG ratio calculations, with the important addition of the dividend yield obtained from the Company Profile. As with the PEG ratio, anything between 0 and 1 is considered undervalued, and more than 1 is overvalued.
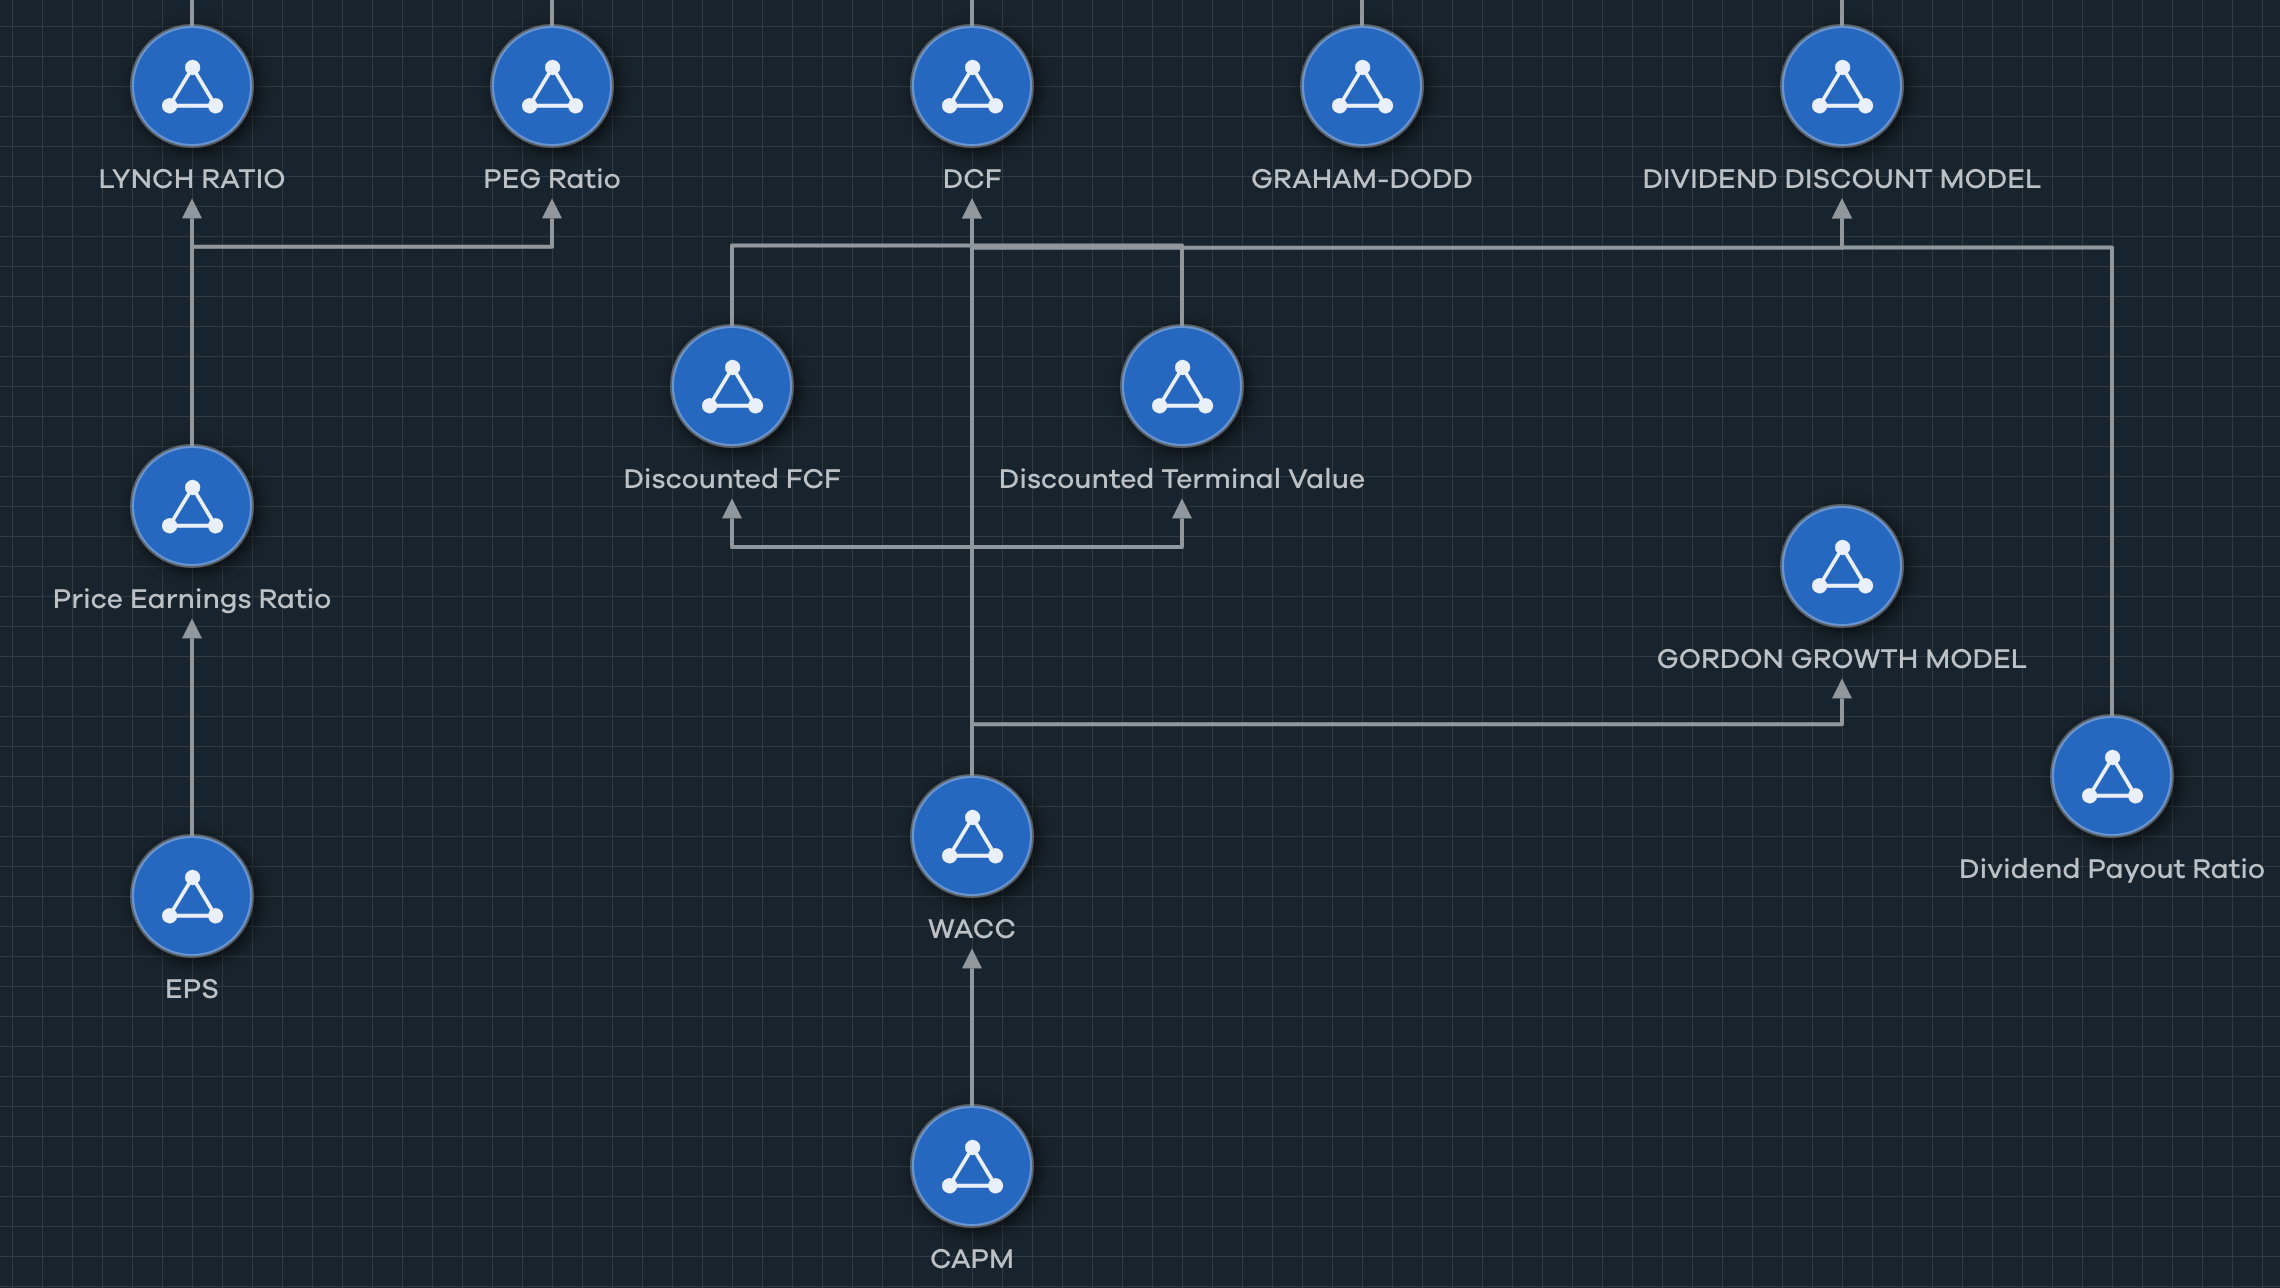
Method Three: Discounted Cash Flow
The DCF is our most complex formula, and relies on the accompanying WACC model.
DCF finds a company's intrinsic value, based on the sum of all future cash flows discounted to today's value plus the difference between cash_and_equiv and total debt.
The formula looks like this:
CF1 / (1 + r)1 + CF2 / (1 + r)2 + . . . + TV/(1 + r)n + (cash - debt)
To break this formula down:
CF= The expected cash flow for a specific period (e.g.,CF1= cash flow year one).r= The discount rate.TV= The terminal value (estimated cash flow aler the projection period).n= The specific period (e.g., years, quarters, months, etc.).
Calculating WACC
It is possible to use a flat discount rate, but more accurate to discount future free cash flows by using WACC. WACC uses CAPM to calculate Cost of Equity, and we perform these steps in Authoring to calculate the intrinsic value of a stock:
- Calculate cost of equity using CAPM.
- Using CAPM, calculate WACC using the formula:
WACC = (E / V * Ke)+ (D / V) * Kd * (1 - tax_rate).
These parts come together in the computations calculating the Weighted Average Cost of Capital (WACC). Next, WACC is used for calculating Discounted Cash Flow (DCF):
- Discount future free cash flows, calculated in Jupyter notebook. The array of future free cash flows is ingested into Kafka, and appears as a field in the
cash_flow_statementtopic. To discount those values, we use the following formula:future_free_cashflow_i / ((1 + WACC) * i), whereiis the number of years projected into future.- The computation formula increments i by 1, such that
i = 1, then two years from nowi = 2, etc. Our model begins with one and goes up to five.
- Calculate the terminal value and discount it. The terminal value is calculated using the following formula:
(FCFn * (1 + g)) / (WACC - g), where:FCFnis the last projected future cash flow, up to five years away.gis the perpetual growth rate, which we set equal to 2.5% or0.025.
To discount the terminal value (which we calculated as part of the discounted terminal value pattern computations) we use this formula:
Discounted_TV = TV / ((1 + WACC) ** n), where n is equal to five (or the number of years our FCF array projects into the future.
- Calculate the stock's intrinsic value:
- Add the sum of discounted future cash flows and the terminal value
- Adjust by the difference of
cash_and_equivand total debt - Divide the result by the number of outstanding shares to arrive at the stock's intrinsic value.
This operation is carried out in our DCF pattern.
The final output contains the stock's intrinsic value.
Method Four: Graham-Dodd Formula
Benjamin Graham's original formula for finding the intrinsic value of a stock was V = EPS * (8.5 + 2g), where:
EPSis 12-month trailing earnings per share of the company.8.5is the P/E ratio of a zero growth company.gis the long-term growth of the company.
Later, the formula was revised to also include risk free rate of 4.4% and AAA corporate bonds (Y), resulting in the following:
V = [EPS * (8.5 + 2g) * 4.4] / Y
We used this updated formula in our model, getting the TTM EPS from the company's Income Statement, Five Year Growth from its profile, and AAA yield from Market data.
Method Five: Dividend Discount Model
The idea behind the Dividend Discount Model (DDM) is that the stock's intrinsic value is the sum of all future dividend payments. DDM uses some assumptions such as:
- The expected growth rate of dividends.
- The cost of capital.
According to DDM, a stock's intrinsic value is V = Next Year Dividend / (Cost of Capital-dividend growth rate).
The previous WACC formula was used to calculate the cost of capital. The dividend growth rate is based on the past four to five years' of dividend average growth rate data.
Using the formula dividends paid / shares outstanding, we divide the result by EPS. Because a high dividend payout isn't always sustainable, we set the dividend growth rate to 0.75 * average growth rate if that result is greater than 0.6. Otherwise, it is set to 0.85 * average growth rate.
We calculate next year's dividend by multiplying the current dividend (taken from Company Profile topic) by 1 + growth rate. Next, we divide by the difference between cost of capital and growth rate.
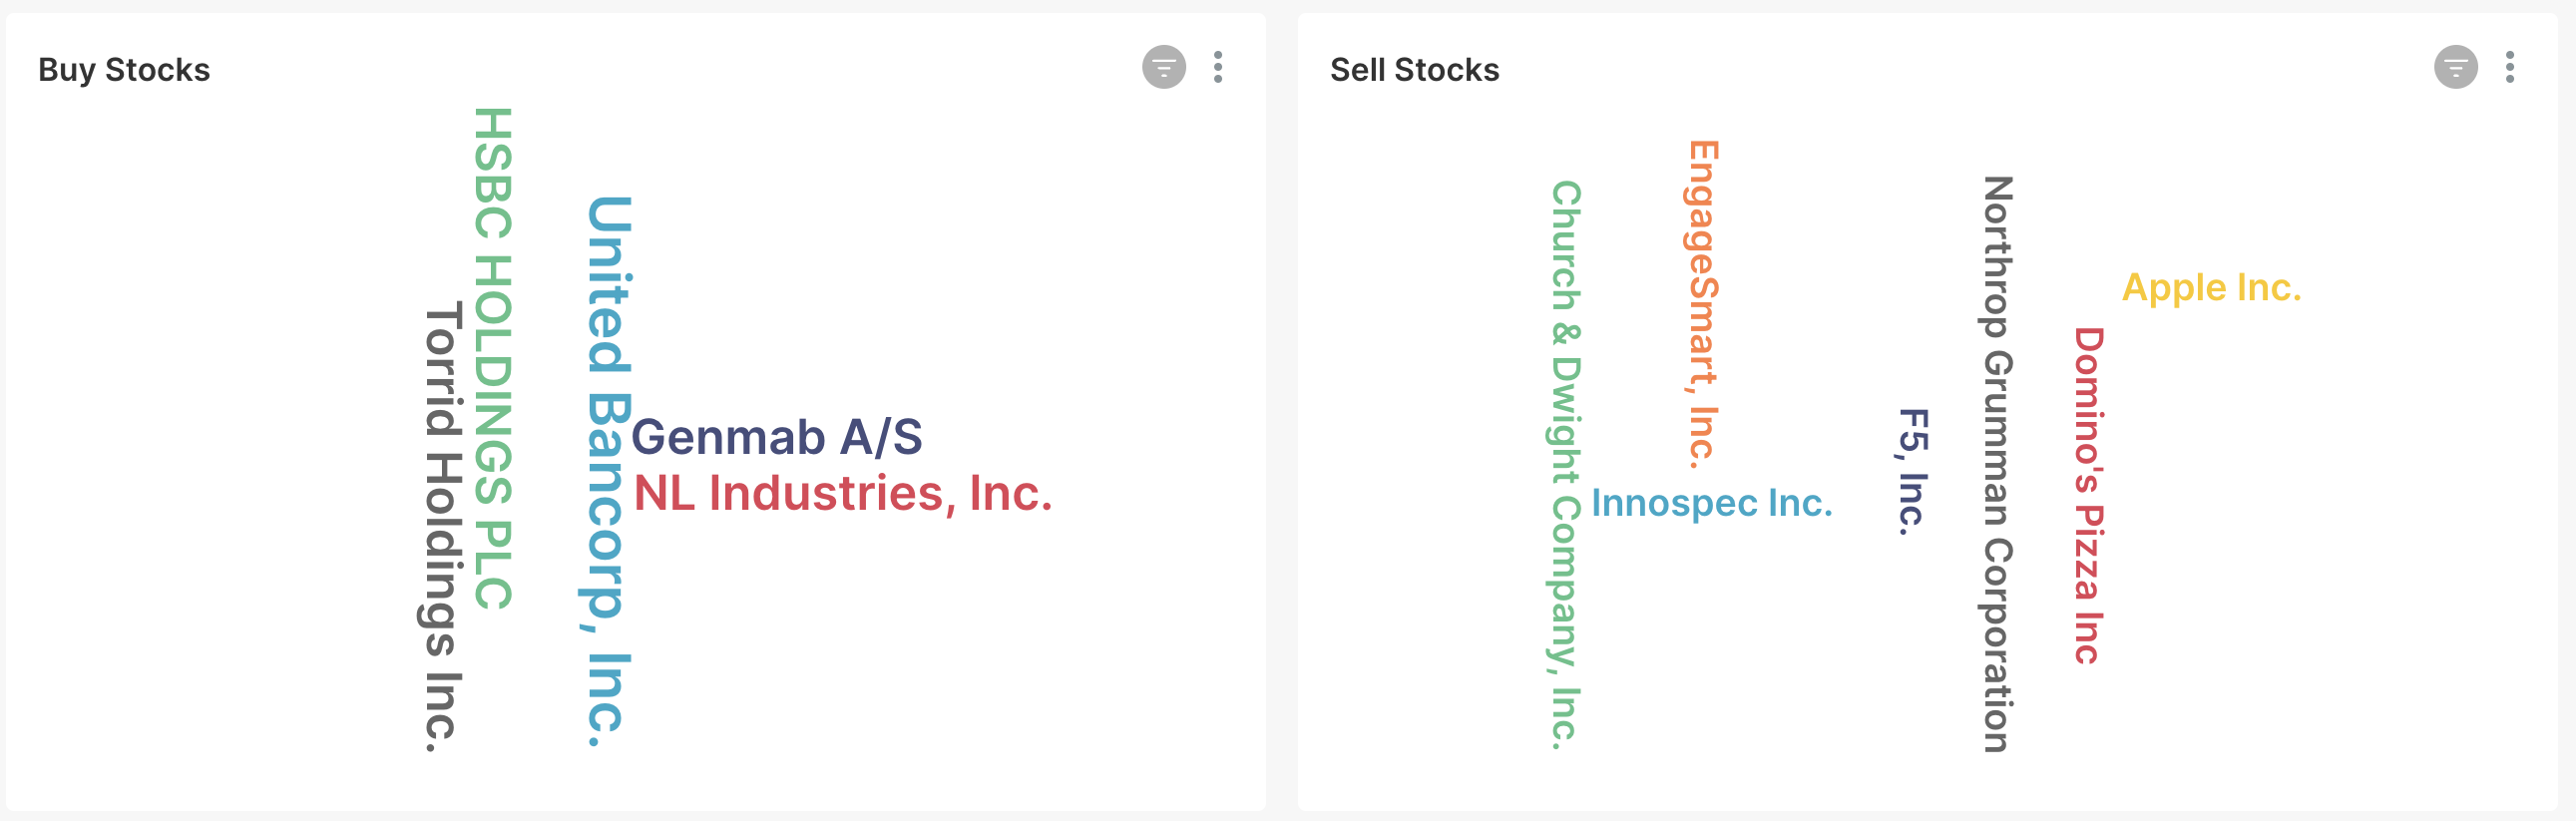
Valuing The Stock
Once all methods are calculated, the last step is to determine whether the stock is over or undervalued. The next two patterns (named Overvalued and Undervalued) are used with the following input topics and conditions.
Topics:
- PEG
- Dividend Discount Model
- DCF
- Lynch Ratio
- Live ticker data
- Graham-Dodd analysis
- Company profile data
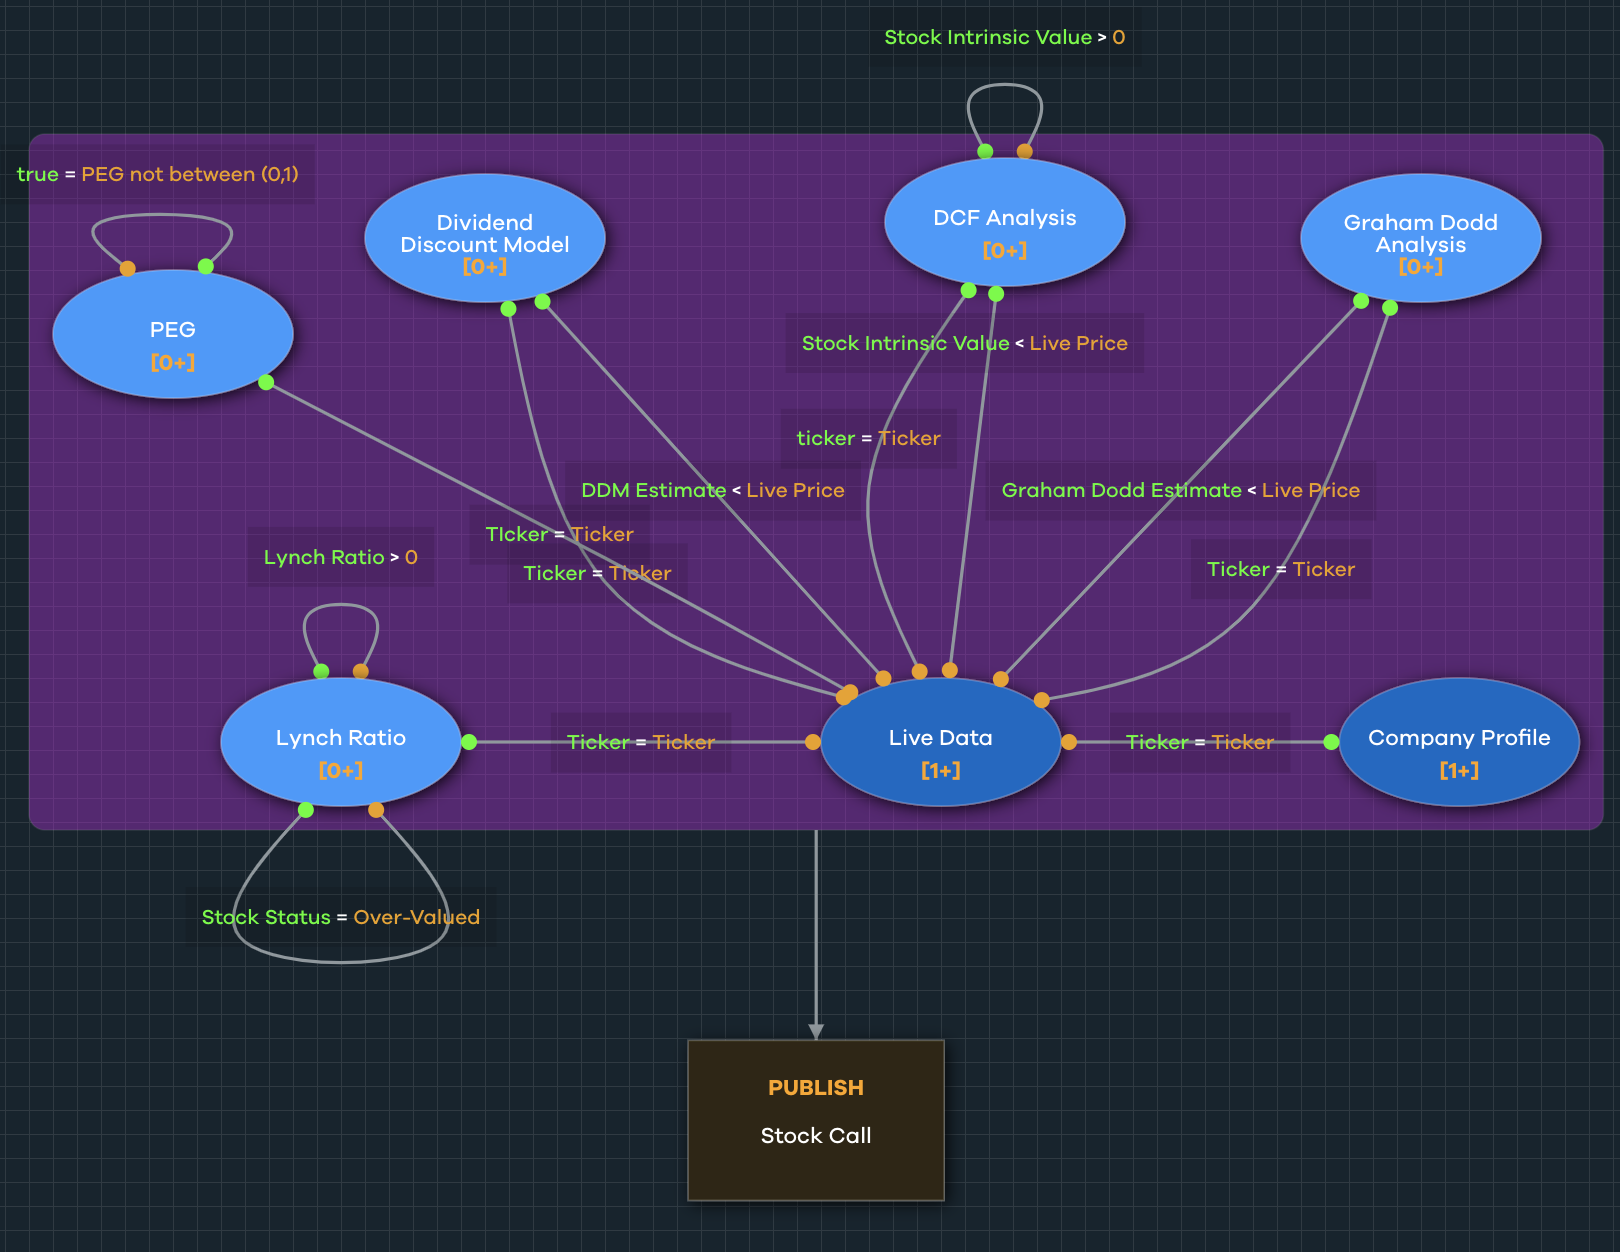
To determine whether a stock is undervalued, these conditions should be met:
- DDM estimate > Live Price
- DCF estimate > Live Price
- Graham-Dodd estimate > Live Price
- Lynch outcome = Under-Valued
- PEG Ratio is between (0,1)
Companies are considered overvalued when these conditions are met:
- DDM estimate < Live Price
- DCF estimate < Live Price
- Graham-Dodd estimate < Live Price
- Lynch outcome = Over-Valued
- PEG Ratio is not between (0,1)
Both patterns are output to the same topic called stock_call.
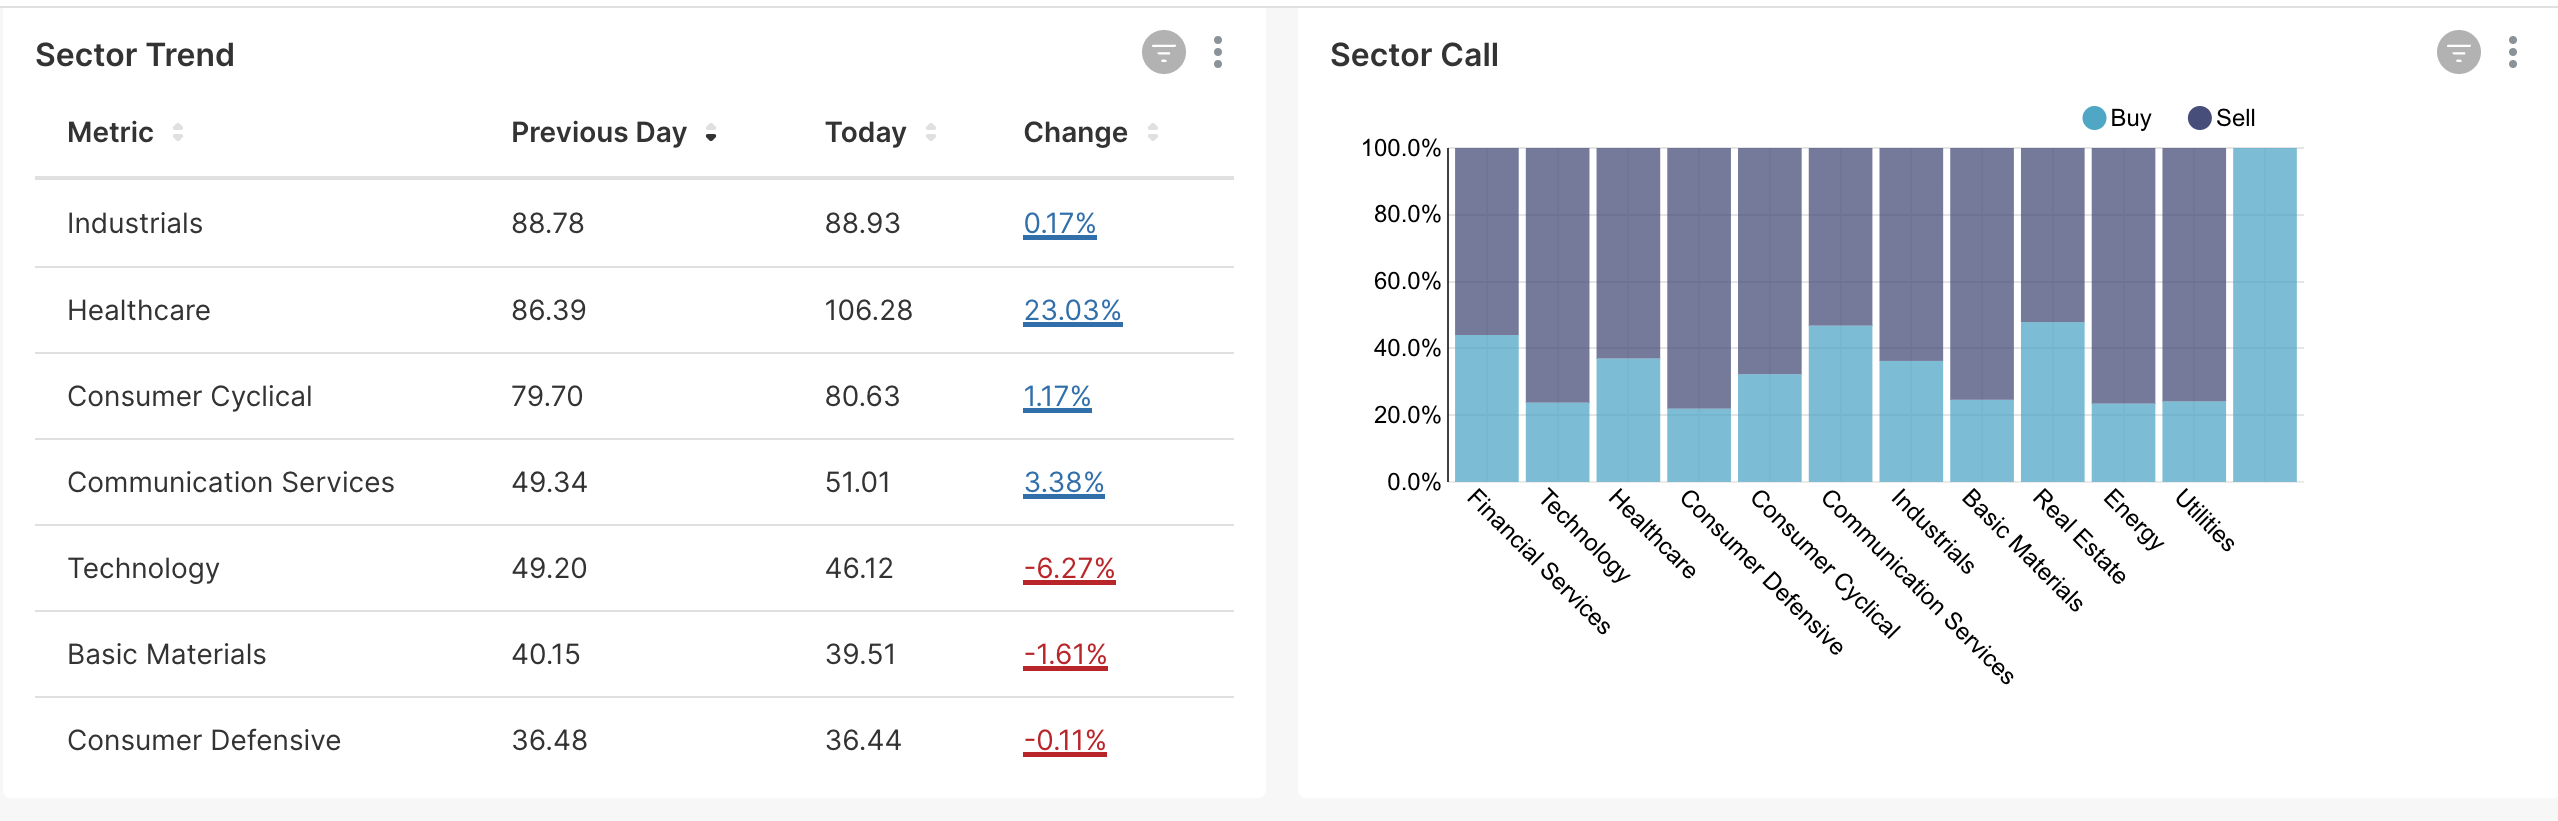
Since our patterns assign risk, we can use the output data in Superset (part of the Cogynt distribution) for a more in-depth glimpse into stock trends.
Bayesian Risk
Each of the under- and overvalued patterns uses a Bayesian Risk table to assign confidence levels to combinations of conditions. With risk thresholds, analysts in Workstation can set alerts for a specific risk threshold, looking into any company rated >60, for example.
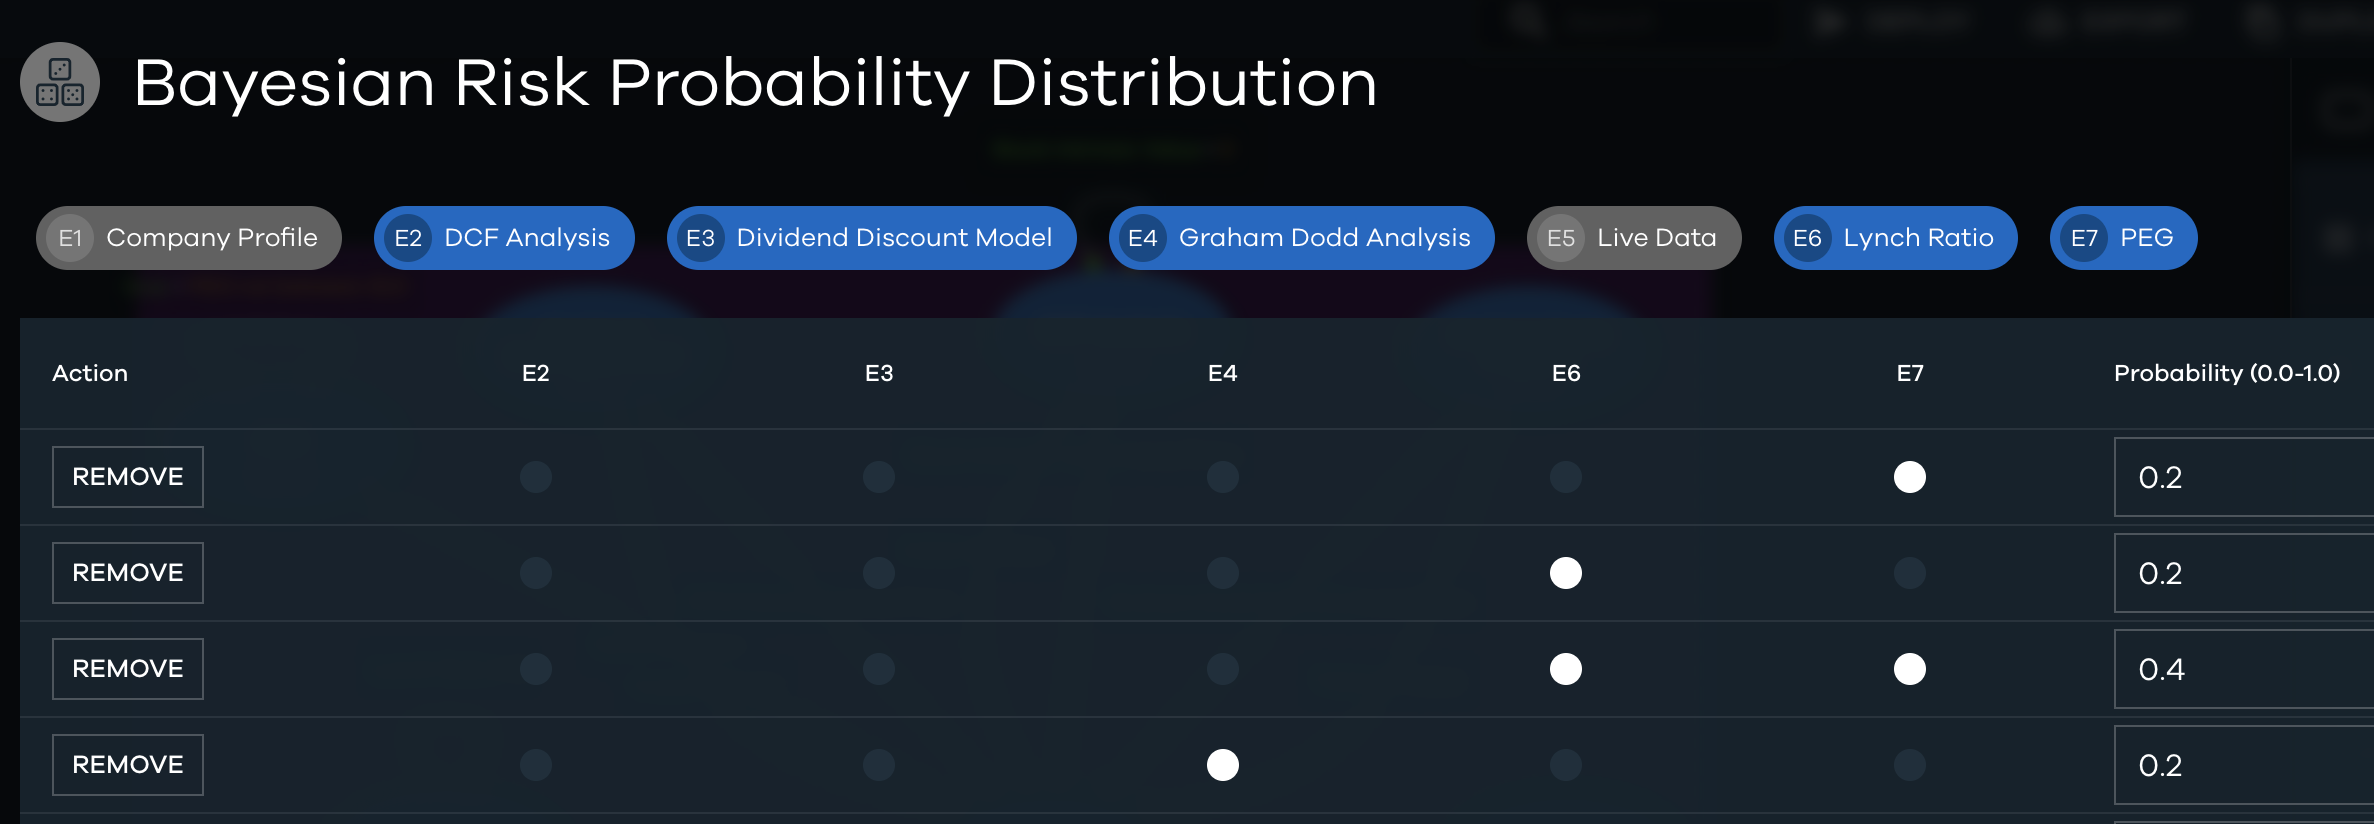
A risk threshold of 0.01 is set for the Bayesian risk table to eliminate any outcome that has 0 confidence, meaning none of the above conditions are met.