Hierarchical Complex Event Processing for Preemptive Fire Hazard Detection
When fire risk rises, power companies face a unique threat. Their infrastructure is often located in remote areas where conditions on the ground are difficult to assess. An active or probable fire impacts power grids in various ways.
A running station might start a fire and would require careful monitoring. Loss of power could complicate evacuation or rescue attempts. Accurately predicting which stations must shut down and when is vital for keeping electricity moving continuously through the grid.
Complex coded solutions exist for these kinds of events, but Cogynt's intuitive no-code approach offers visual problem solving. This use case uses simple calculations with real-time data streams to think through and identify problems preemptively.
Small fluctuations add up to larger threats that humans can miss. Cogynt's answer is a model built around flagging the conditions that lead to fires before they occur.
After all, shutting off the power is no light task.
About the Sample Dataset
The sample dataset used in this use case is from a power company with three zones. It charts temperature, humidity, and usage by zone with relevant timestamps.
Note
Typically, Cogility recommends keeping some data in a separate schema. For example, separating power consumption from weather data.
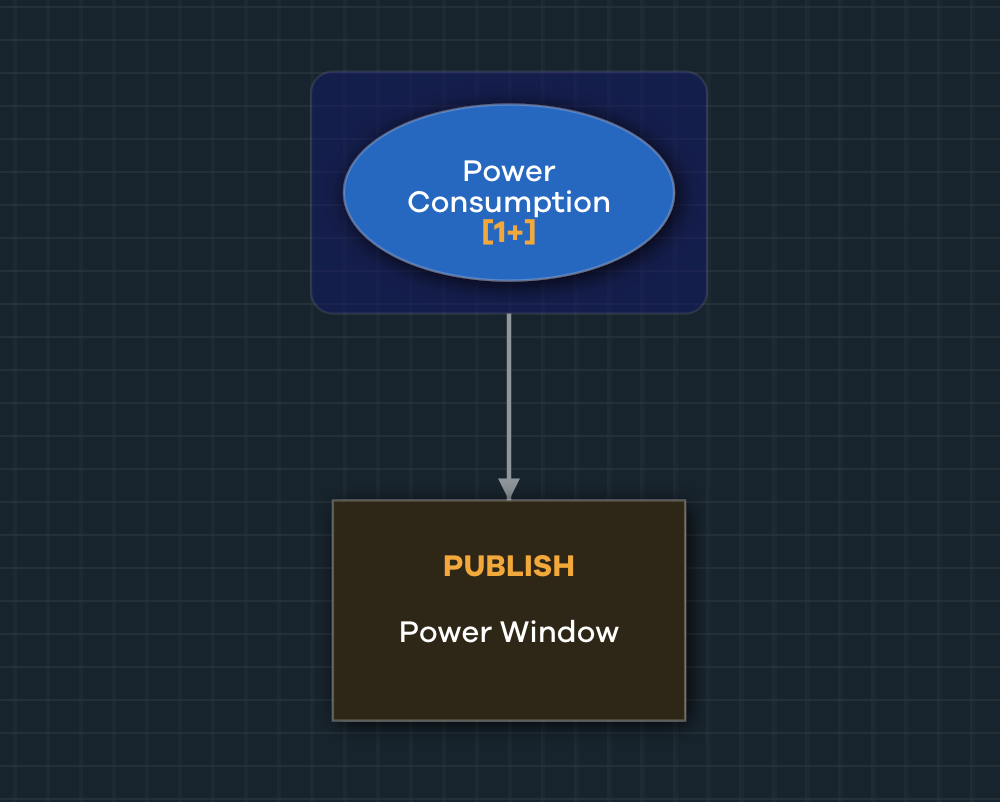
Start with a simple model that uses sliding windows that look at one hour's worth of data. Because readings arrive in 10 second intervals, 60 data points will process in a one hour window.
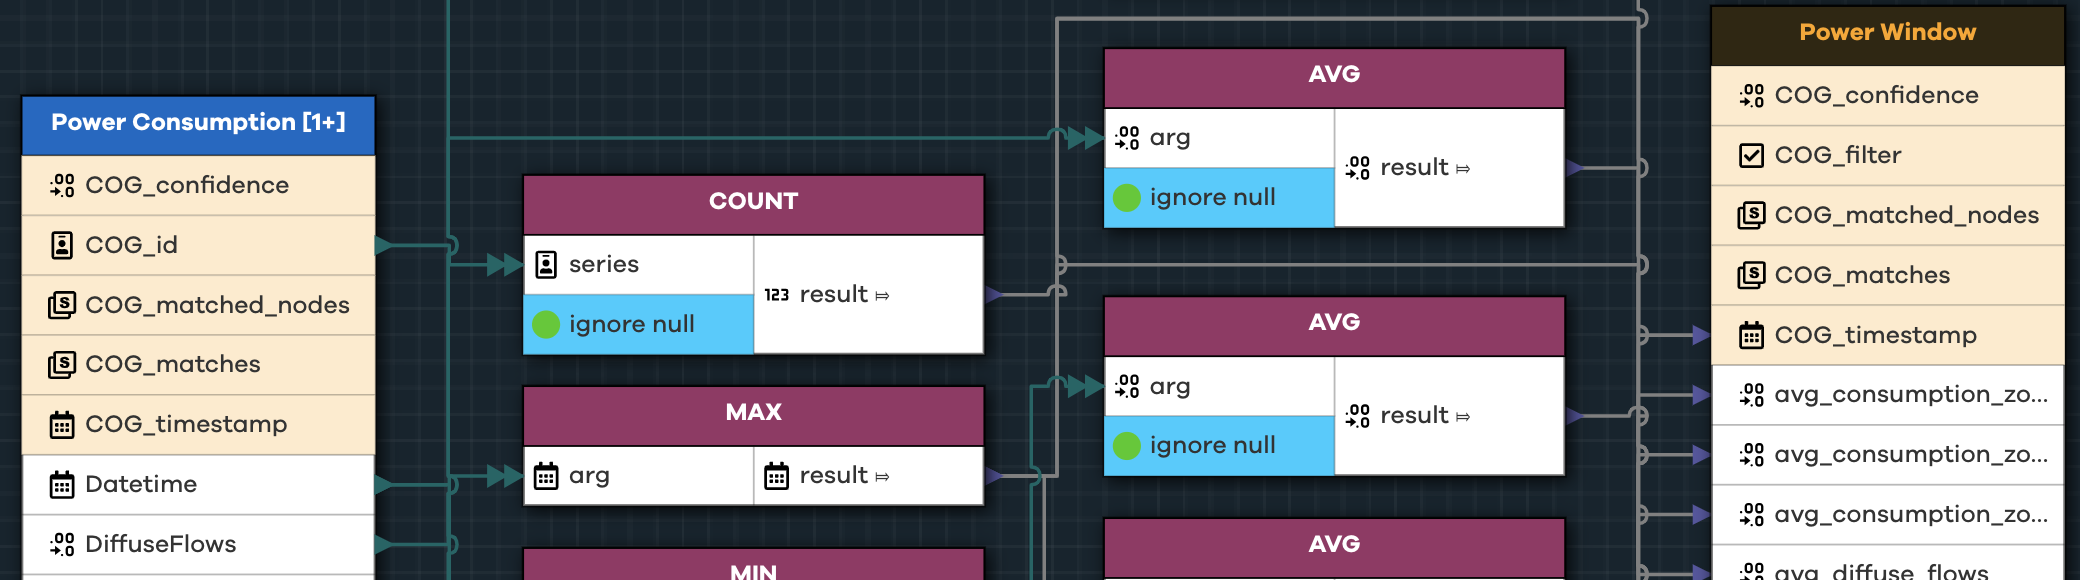
Technically speaking, this model:
- Retrieves a count of all records for the minimum and maximum timestamp (as data streams).
- Computes the averages of those records for each relevant value (power consumption, wind speed, humidity, etc.).
- Publishes those records to a new event pattern node called Power Window.
The outcome essentially averages power consumption, wind speed, and humidity for the data set.
Flagging Fire Conditions
This model is a good start, but Cogynt can draw more meaningful conclusions from the collected data with a bit of expansion.
The goal of this expanded model is to visualize the conditions that raise the probability of a fire occurring or spreading. Since wind is the fundamental ingredient for this fire model, the model uses the presence of humidity to help assign degrees of risk.
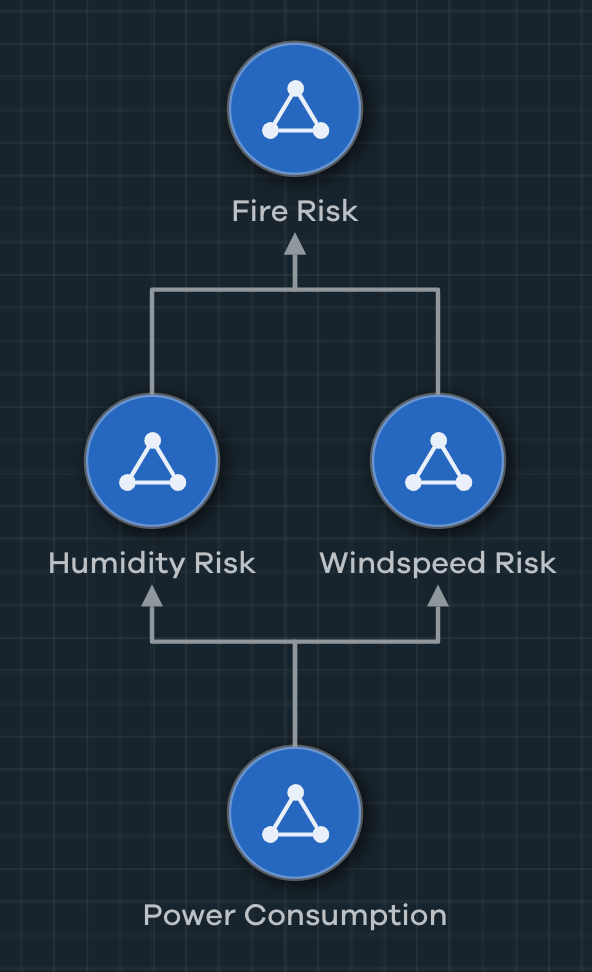
To simplify, this model focuses on two problem areas, and assigns risk accordingly. The logic can be outlined as follows:
- Create an event called Wind Risk. Publish this event when wind speed is greater than 25 mph.
- Create an event called Humidity Risk. Publish this event when humidity is below 15%.
- Create a Fire Risk event that helps find the extent of the risk. It should assign risk depending on ground conditions.
- If either of the lower-level conditions are met, escalate the issue so that the model will assign degrees of risk to each event.
Creating the Wind Risk Event
Begin with the wind speed event. Winds exceeding 25 mph can break overhead power line connections, causing critical conditions on the road or triggering fires from blowouts. Wind is fundamental to fire risk, especially so with sustained winds of three or more hours. It can spread embers, gather flammable materials (such as dry forest growth), or even make fires rapidly and unpredictably change direction.
To evaluate when winds are sustained, and not just periodic gusts, use the averages of the 60 data points collected during the previous pattern.
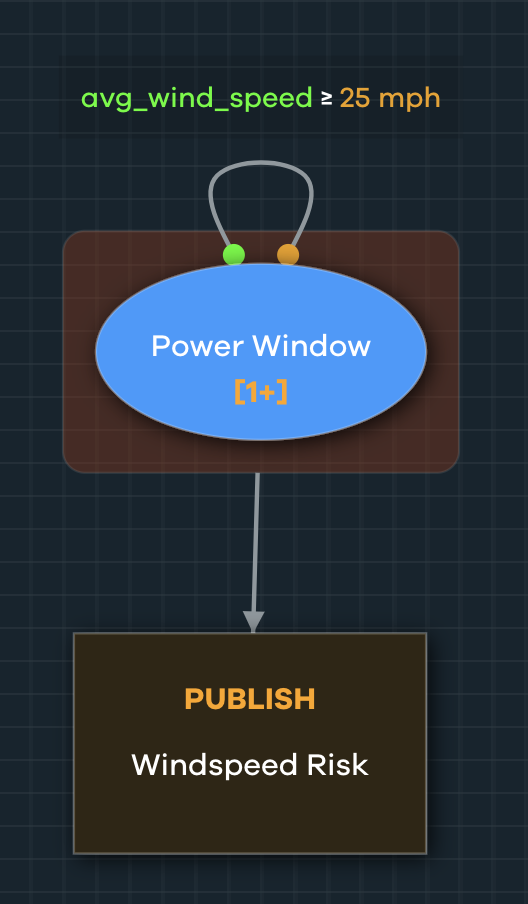
When wind speeds for the hour fall within the defined tolerance, have the pattern move up one tier to the Fire Risk event. Then look more deeply at the conditions and assign some risk scoring.
Creating the Humidity Risk Event
When humidity is around 15% and wind speeds are high (as high as 25 mph), the risk of fire increases. It's not guaranteed, but these arid conditions enable fire to spread.
The humidity risk event pattern is focused on flagging these moments and publishing the average wind speed and humidity during the window. Decision makers get system notifications informing them of these events in Workstation, where they can perform further analysis with empirical evidence.
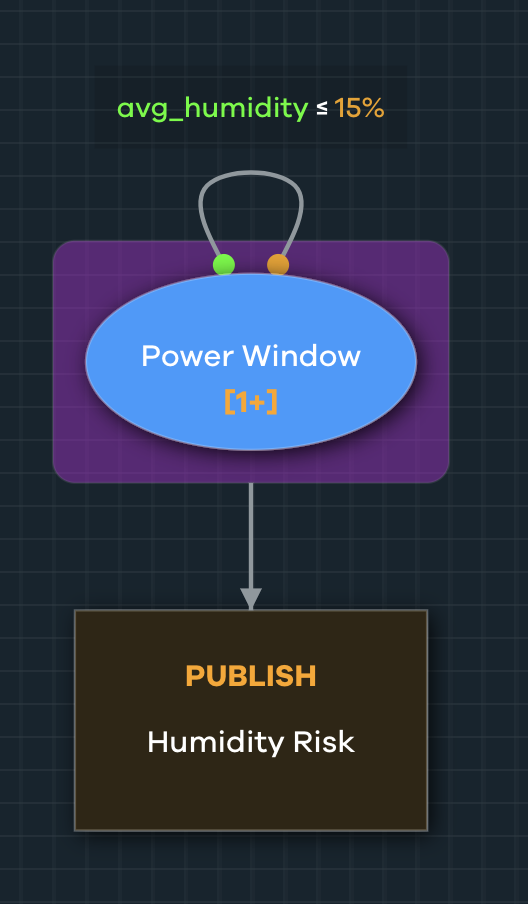
The Humidity Risk event pattern node publishes an event only when average humidity over the course of the hour is below 15%.
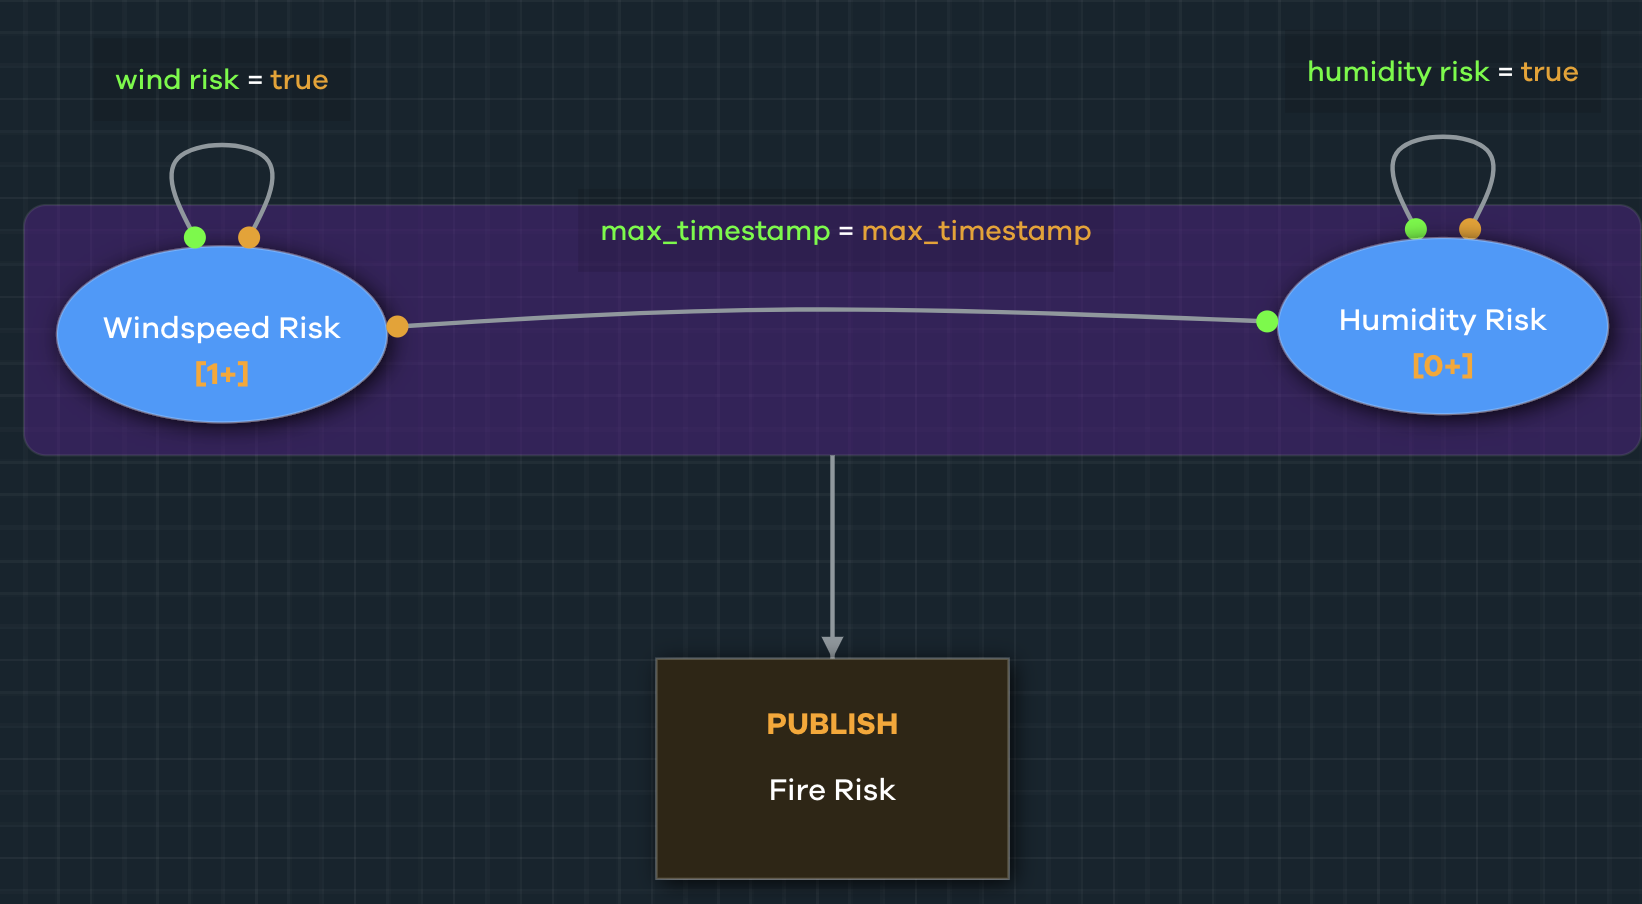
Creating the Fire Risk Event
With these two patterns, one for wind and the other for humidity, the Fire Risk event is ready. Match the timestamps for the humidity and wind speed events, making the humidity event optional. If wind speed is triggered, it will trigger a fire risk event regardless of whether humidity is present.
Using a Bayesian Risk Table, assign a risk score. Here, we used an arbitrary .5 for wind only, and a 1 to signify wind and humidity risk.
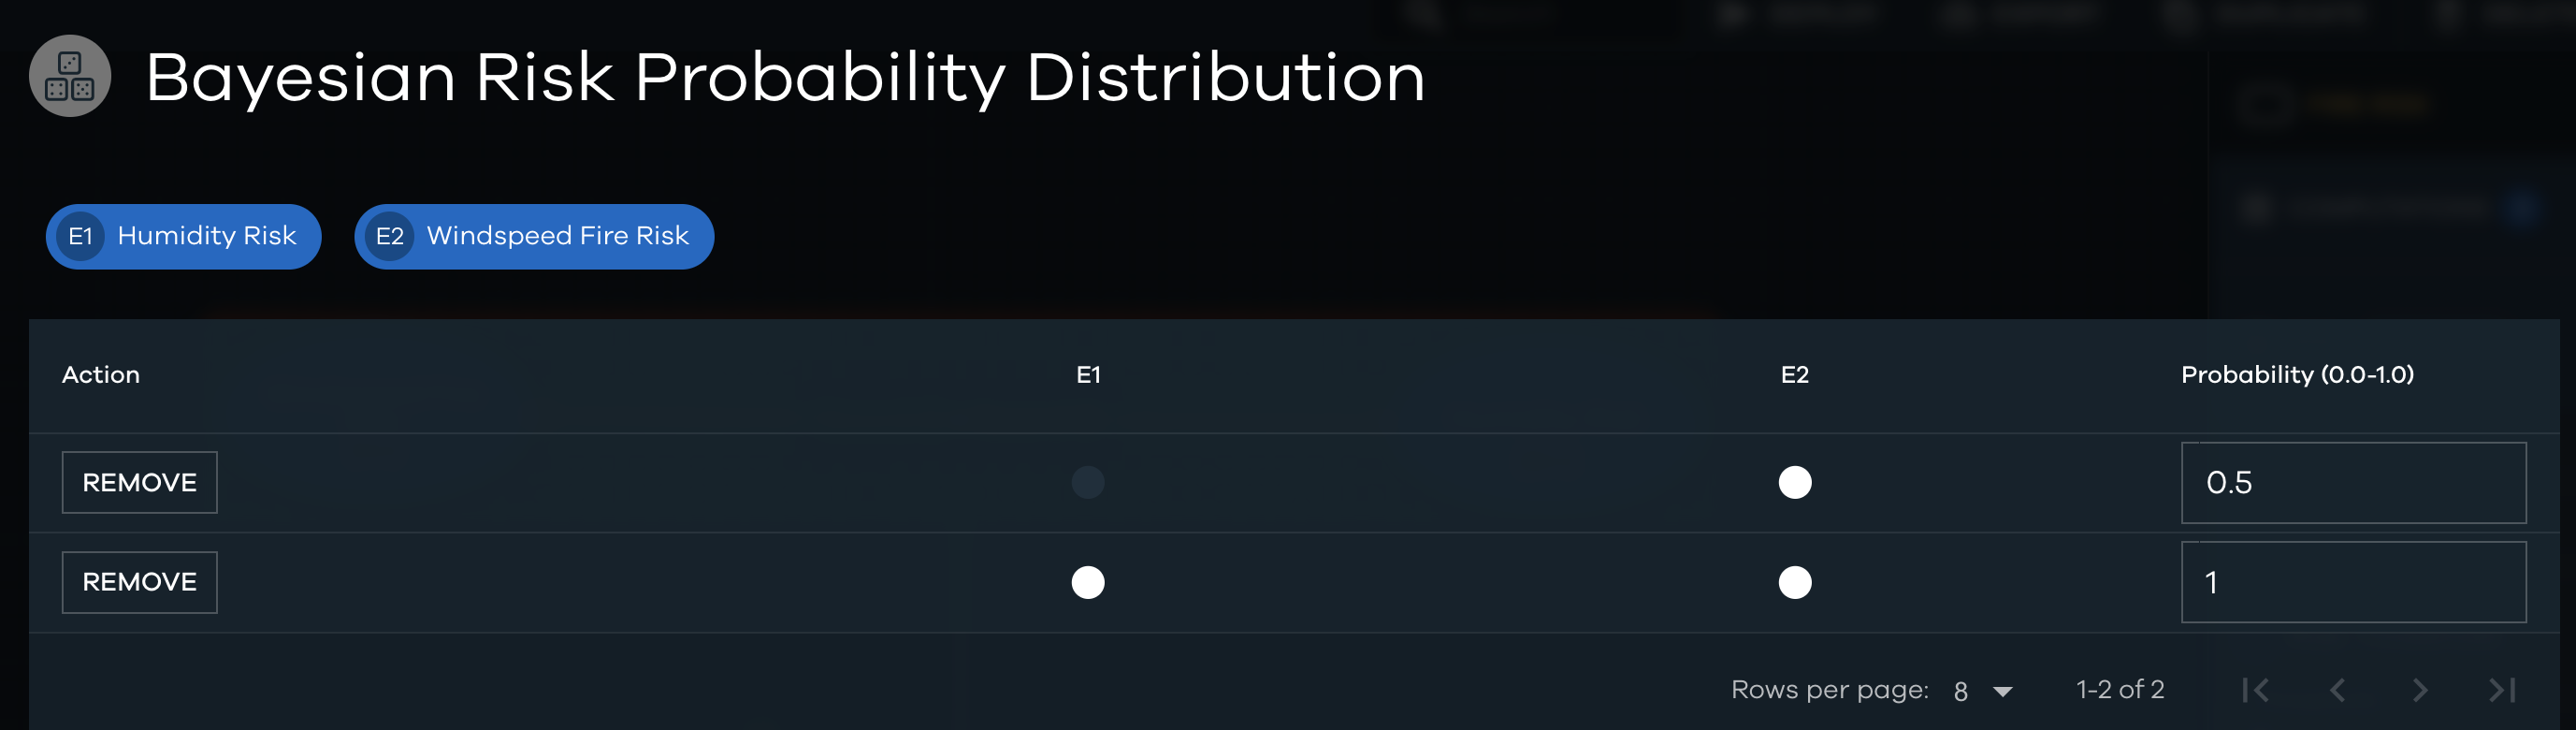
When the conditions exist, Workstation analysts receive an event called "Fire Risk," and subsequent related events for wind and humidity risks. Risk scoring ensures notifications are sent only when the chosen risk threshold is reached.
Optimizing the Fire Risk Model
Optimizing this model is a necessary step in building out a more complex system of patterns. For example: charting when a station is close to hitting its threshold when heatwave conditions exist, or charting power allocations by zone.
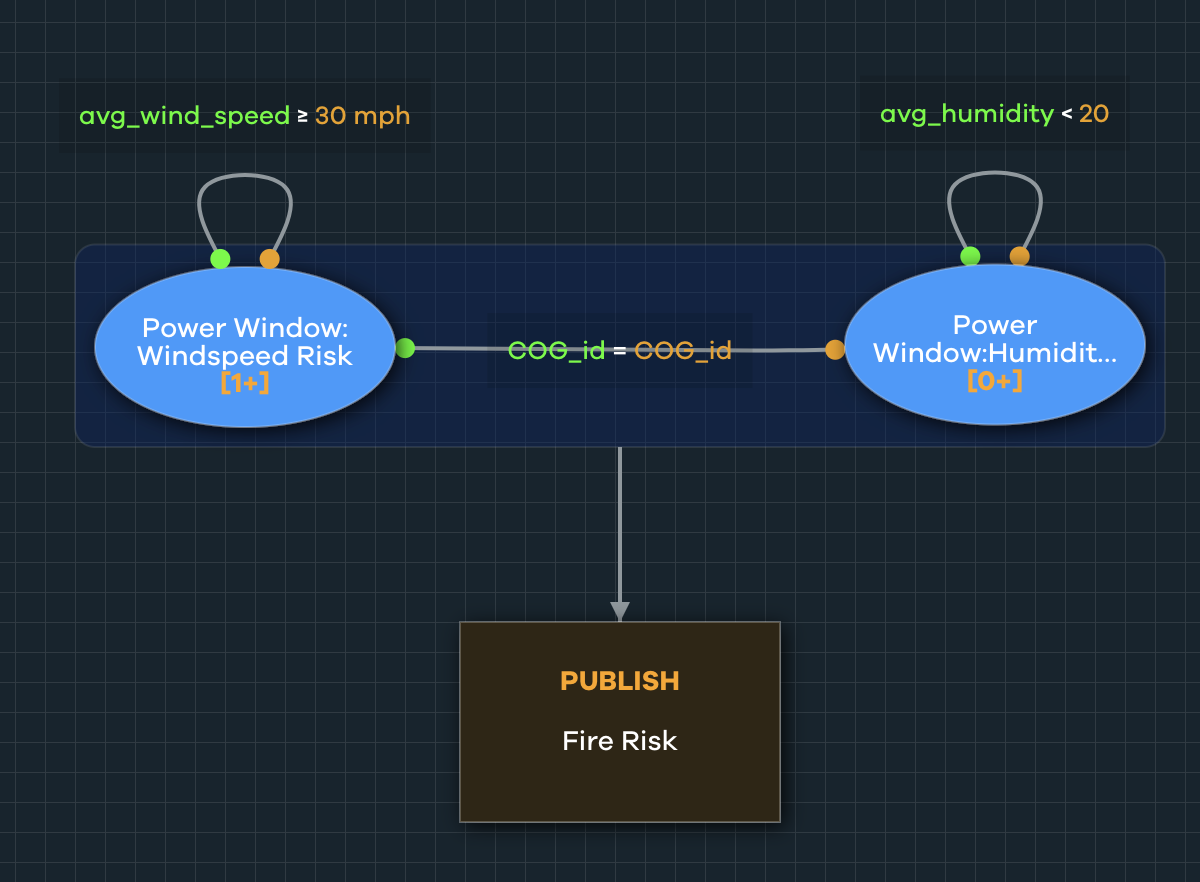
Building Fire Risk in a Single Node
The calculations used to determine wind speed and humidity fire risks fit into a single event pattern node. Using the event record (this example uses COG_id, or the record count generated by Cogynt), match patterns that have a humidity risk to patterns that have a wind risk.
Reviewing Data in Workstation
After deploying the model, ingest the outcome events into Workstation to view them. Analysts have a wealth of data at their fingertips.
Viewing Event Details
If you utilize Bayesian risk scoring, analysts will receive notifications based on when events reach that predefined threshold. Otherwise, the event stream contains every event published by Cogynt Authoring. From any open view, drag events into Object Details Viewer to review their details.
Other Useful Widgets
With the proper data, many Cogynt widgets can assist in analysis:
- Use the Map widget with geographic data to see events plotted in geographic locations.
- Drilldown with larger models can help analysts see the event provenance.
- Event Detail Templates can help unify the presentation of data for readability and ease of human processing.
Wrapping Up
Using some sample power data, a simple model can tell us when weather conditions on the ground present a severe fire risk. The model is visually simple to understand, and can flag a range of critical conditions with room for expansion.
From windspeeds to natural disasters, and everything in between, Cogynt can help stakeholders make informed decisions during critical moments in the room.