Causal Forecasting in a Ride Share Network
Managing a global ride share marketplace – which entails keeping track of riders, drivers, rates, and other logistics – is no small task. Ridership numbers and profitability can be changed in an instant by any number of occurrences. For example, a rainy month can push ridership numbers down in a given region, whereas increasing rider discounts could improve ridership numbers. Combining these two events could have a tangible effect on ridership numbers.
This is where causal modeling comes into place. Causal modeling is a technique that data scientists use to understand the impact an event or combination of events has on the outcome of other events. These other events could directly affect a company's goals, which makes causal modeling so powerful for organizations.
Before Cogynt, causal modeling relied on advanced mathematical and programming skills, such as coding in Python or PyTorch, leveraging statistical models, and more. This made causal modeling difficult for organizations to implement. But now, Cogility's continuous intelligence platform lets any operation tap into the power of causal modeling. Cogynt's drag-and-drop user interface greatly simplifies the modeling process.
Other no-code tools are better suited for small and relatively static datasets. Cogynt, on the other hand, uses Apache Flink's state-of-the-art compute fabric to perform causal forecasting for data streams. With Cogynt, you can not only perform causal forecasting using a drag-and-drop tool, but you can throw a firehose of data at it and see accurate outcome events in real time.
This project examines how to use Cogynt to start assembling a causal forecasting model for a ride share operation of any size.
Requirements
This tutorial assumes you have access to:
If you need access to Cogynt, please contact Cogility.
Creating the Model
To begin, log into Cogynt and go to the Authoring Tool to create a high-level diagram of events whose outcomes will impact other events. With Cogynt, this network of impacts is easy to visualize, as seen in the following image.
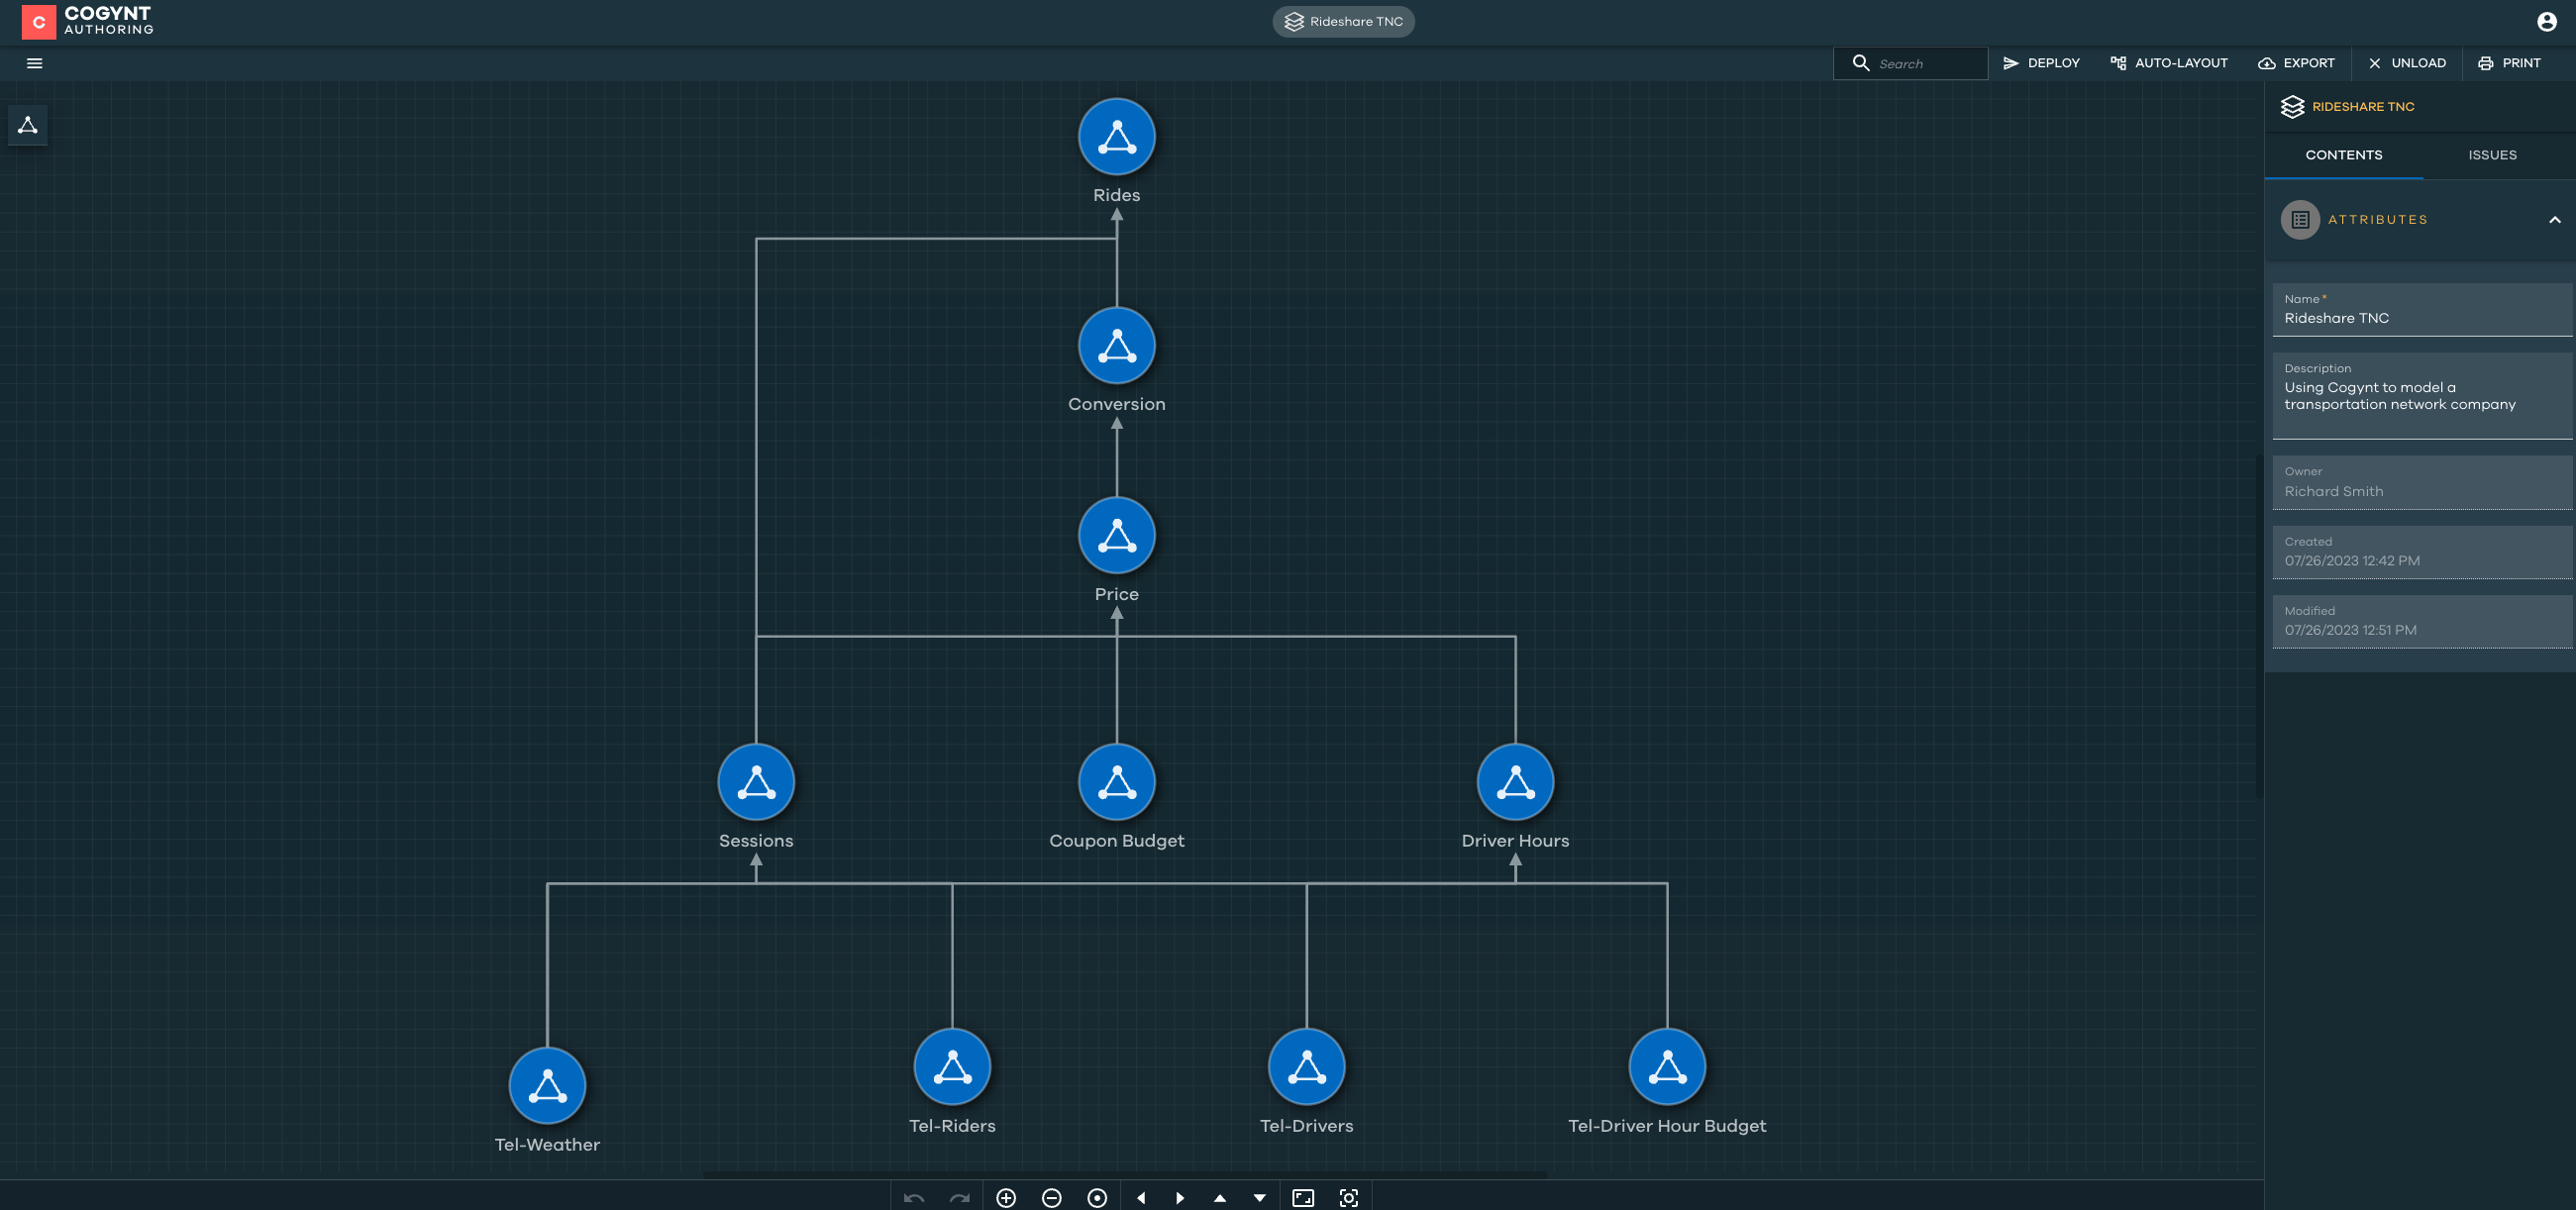
The following is a brief explanation of what's happening in the model shown in the preceding image:
- The
Tel-Weatherevent streams the current weather conditions for a given region. - The
Tel-Ridersevent provides the dataset of all riders in the marketplace. - The
Tel-Driversevent provides the drivers dataset. - The
Tel-Driver Hour Budgetevent contains the current budget for driver discounts for a given region. - The
Coupon Budgetevent contains the current budget for driver discounts.
We call these lower-level events our "telemetry." This set of telemetry flows upward in our graph to impact the outcomes over high-level events such as:
Sessions: Given weather conditions and riders (Tel-WeatherandTel-Riders, respectively), we will be able to forecast the number of rider sessions.Driver Hours: Given weather conditions and the current set of drivers, this allows us to determine the number of hours that will be driven.
These somewhat higher level events will then impact even higher level events, such as:
Price: Given the number of sessions, driver hours, coupon budget, and their lower-level events, we can forecast what the price for a given ride will be.Conversion: Given the price, we can forecast the conversion rate. (For example, a higher price usually means a lower conversion rate, while a lower price usually means a higher conversion rate.)Rides: Given all of the underlying events, we can then forecast the number of rides.
Querying Data Streams
Before Cogynt, querying data streams was notoriously difficult. (In fact, even writing SQL on a rather static set of data can quickly become complex.) Cogynt simplifies this process with its drag-and-drop, no code tool, as shown in the following image.
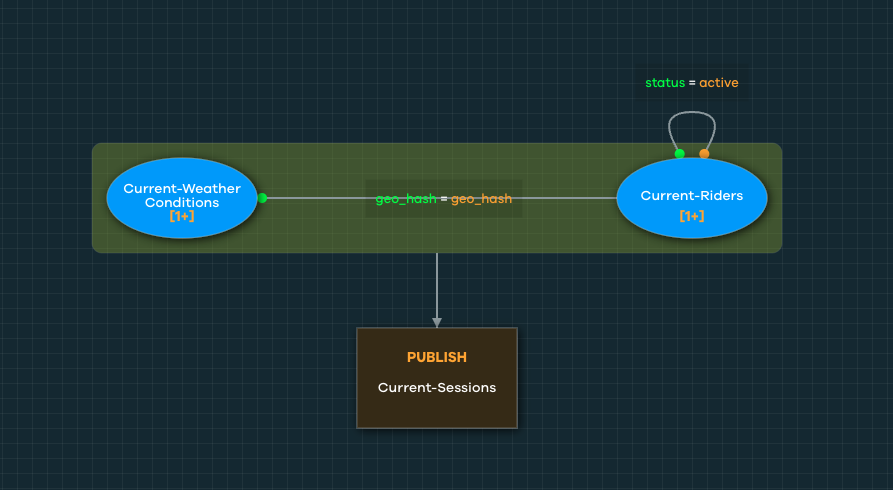
The preceding image essentially says, "Give me the weather conditions for a given region and the active riders for the same region, and use the results in the outcome (Current Sessions)."
Not too intimidating, right?
Transforming Data
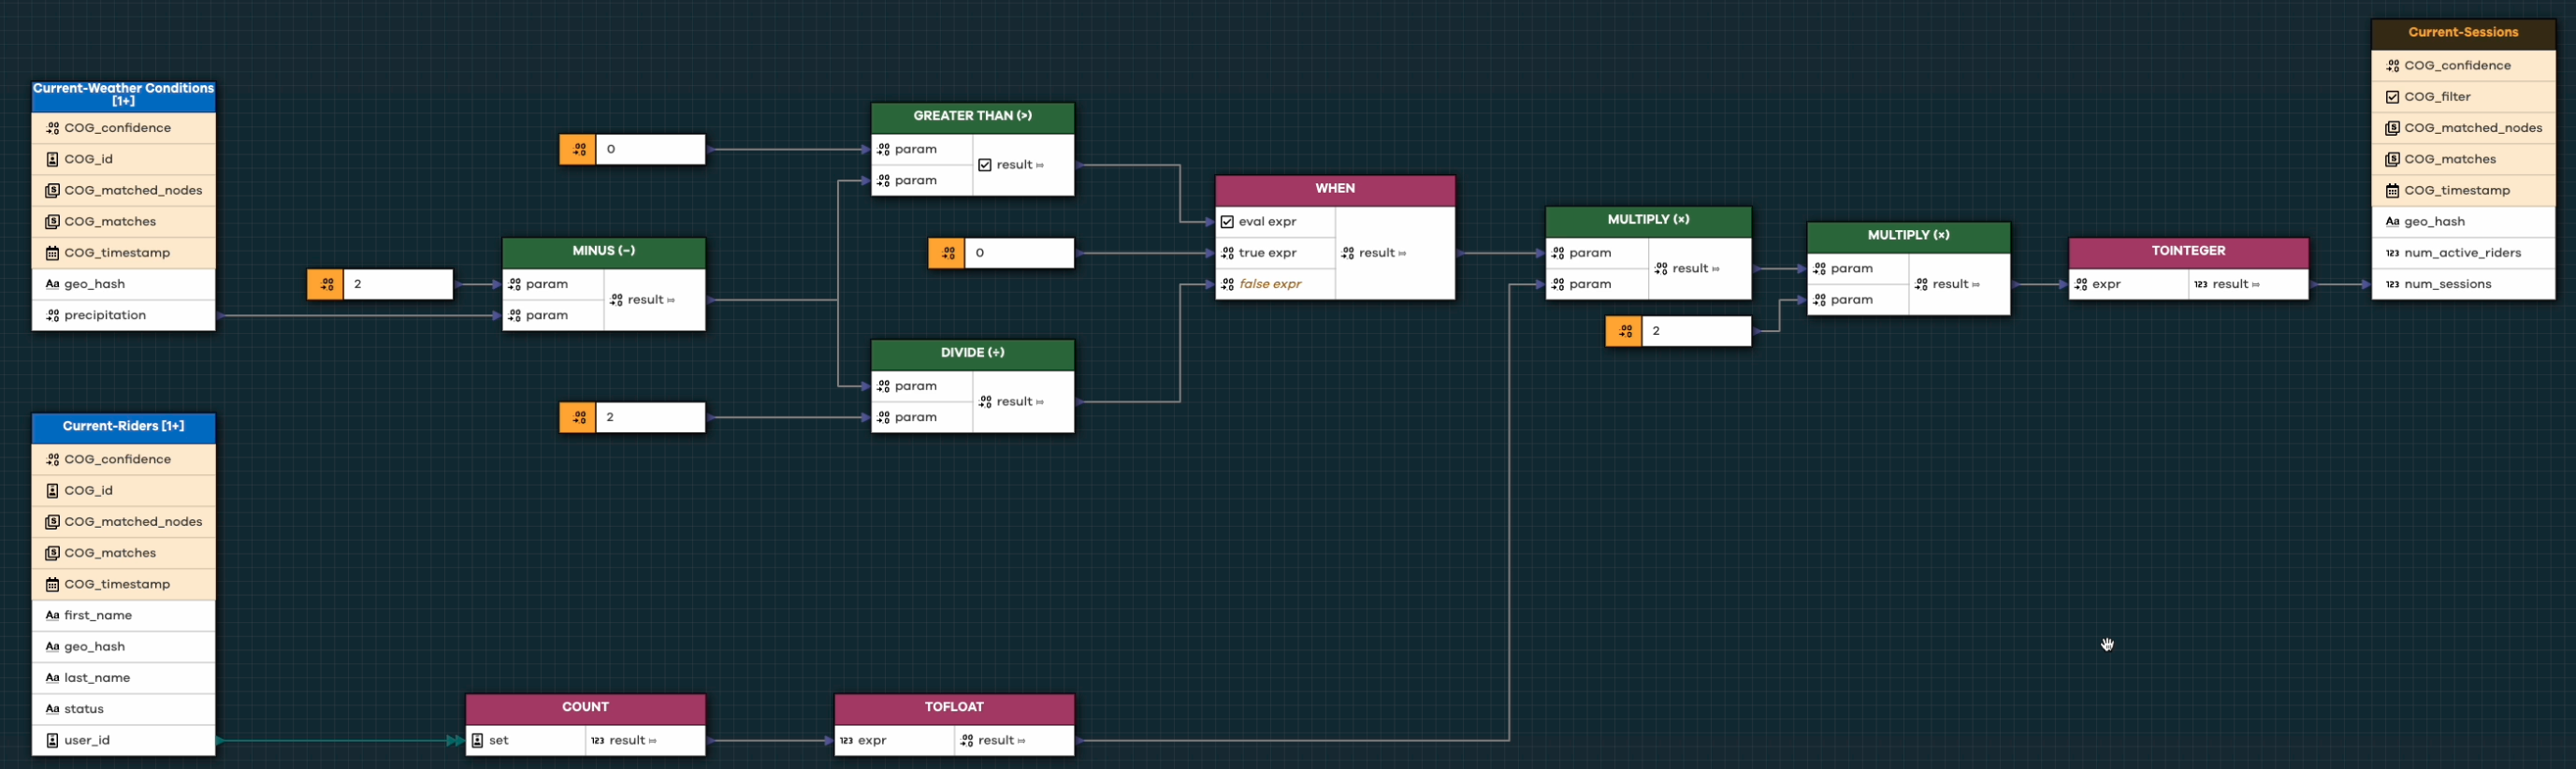
Once you have established your data stream query, you can now use Lego-like building blocks to transform your data. (Many Cogynt users report that this is their personal favorite area of Cogynt.) Instead of writing complicated code in Python, Java, R, or the like, you can continue to use a no-code editor, as the following image illustrates.
Wrapping Up
After creating your forecasting model, you can deploy it as a Flink job. Once it's up and running, how you'd like to ingest data is up to you. You can:
- Publish data directly to Cogynt's built-in support Kafka.
- Upload a CSV spreadsheet.
- Manually enter data points.
When first testing your models, Cogility recommends:
- Uploading a CSV or entering data one sample point at a time.
- Checking your results in Analyst Workstation.
This covers the basics of developing a ride share causal forecasting model! For additional projects and experiments, check out Cogility's sample project library.