Calculating Discounted Cash Flow With WACC
Discounted Cash Flow (DCF) is a formula that attempts to find a company's value, taking into account the current fair value of its assets, projects, ownings, and debts. This model provides a means of calculating DCF. It also attempts to account for inflation and the future value of money, which is a common task for equity research analysts.
DCF is commonly used for:
- Valuing businesses.
- Valuing investments.
- Valuing projects.
- Valuing cost-saving initiatives.
Generally speaking, DCF gives investors a sense of rate of return based on cost. The formula requires a discount rate or a WACC (Weighted Average Cost of Capital), which we computed in place of a discounted rate of 8%. DCF is usually taken in context with other information like market attitude and future projections.
In Authoring, we express this formula through computations.
Computing the DCF Pattern
The DCF event pattern takes financial data by ticker symbol, processes the ticker in an event pattern, and then publishes it to an outcome called DCF Analysis. Calculate WACC using the formula:
WACC = (E / V * Ke) + (D / V) * Kd * (1 - tax_rate)
Where:
E= the company equity or the market capitalization obtained from the company's profile.D= company debt obtained from the balance sheetV=E + D, as calculated in the WACC pattern.E / V= the proportion of equity divide by the sum of equity and debt, as calculated in the WACC pattern.D / V= the proportion of debt to the sum of equity and debt, as calculated in the WACC pattern.Ke= the cost of equity as calculated using the CAPM formula.Kd= the cost of debt as calculated in the WACC pattern, dividing interest expense by the average total debt.tax_rateis obtained fromincome_statement. (Multiplying by1 - tax_rateaccounts for tax benefits.)
Prepping the Data
For this model, we've already calculated the weighted average cost of capital (WACC). We have also pre-calculated free and discount cash flows prior to streaming data into Authoring.
We assume the following:
- We calculate the next five years based on the average growth rate of the previous years of free cash flow.
- We assume a perpetual growth rate of 2.5%.
Step 1: Finding Free Cash Flow For the Furthest Projected Year
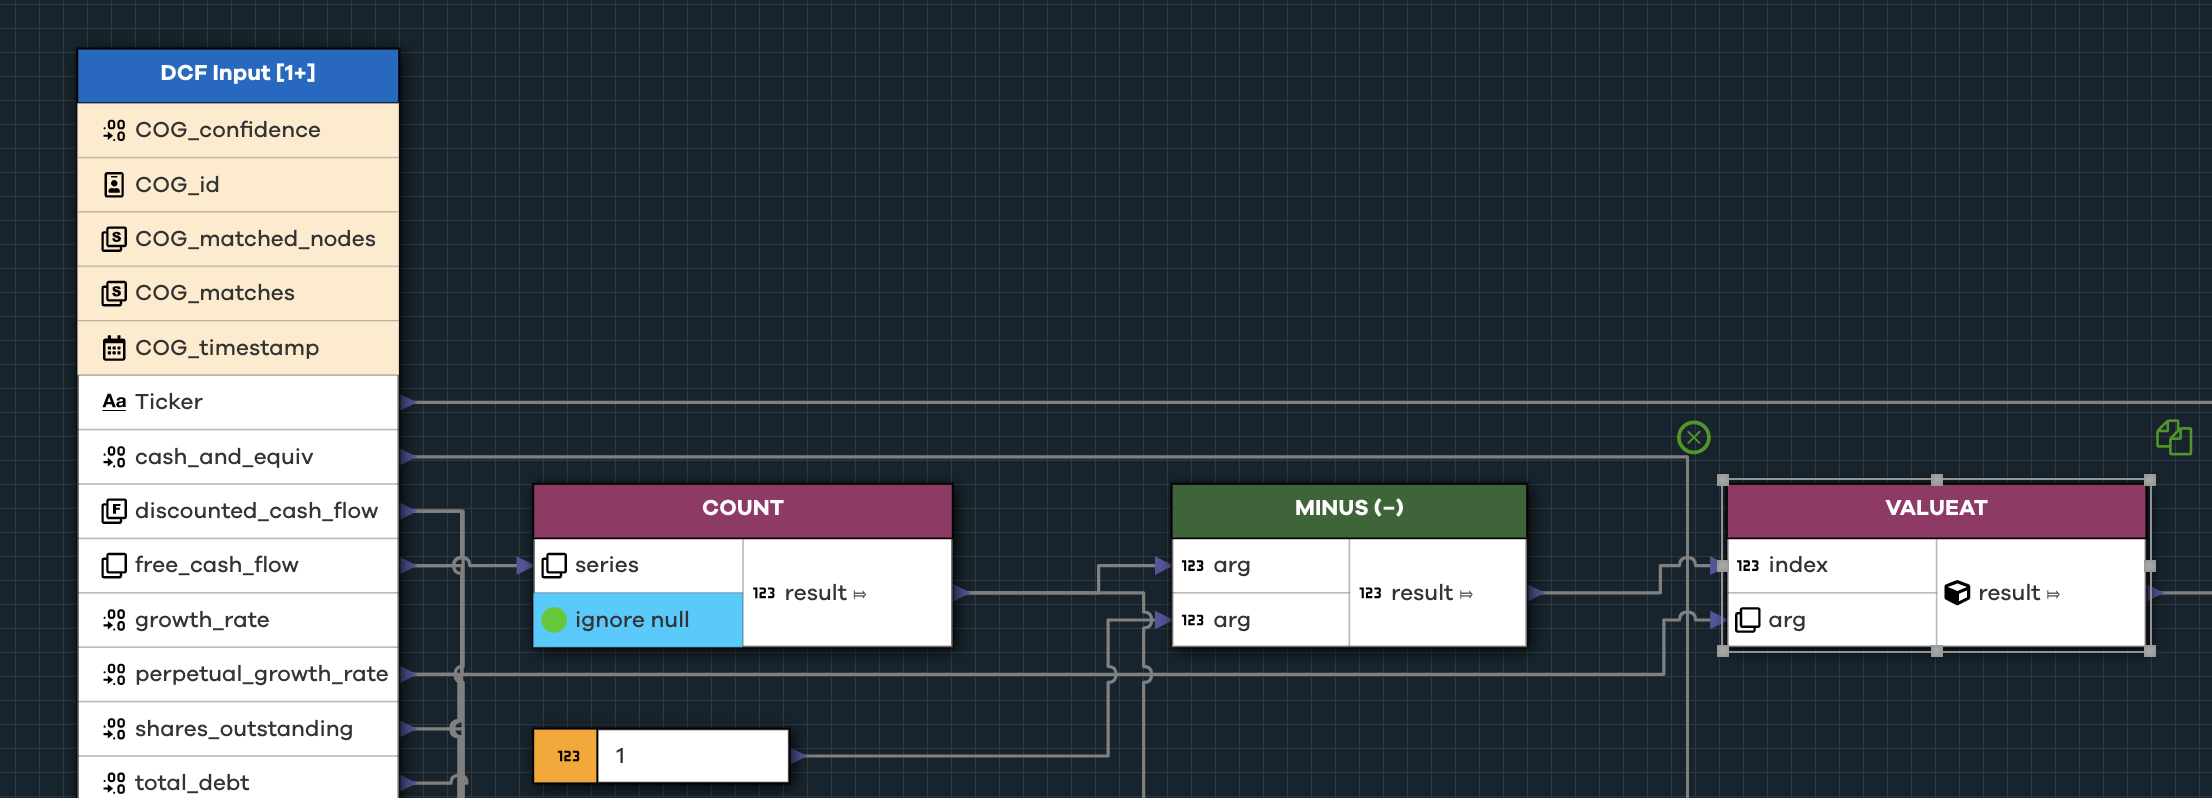
Our first task is to retrieve the furthest projected free cash flow value we computed from a range of up to 5 years to get started.
To compute free cash flow in Authoring:
- Use the
COUNTfunction to discover the length of the array containing all records. SUBTRACTone from the length of the array to set the index to the furthest point.- Use the
VALUEATfunction to retrieve the value that is stored in that index. - Use
ROUNDto round the free cash flow value to the nearest 2 decimal places, as these values can have as many as 10+ digits.
Step 2: Compute the Terminal Value
We need to compute the Terminal Value for this next part of the formula. This value tells us the present value of our ticker at a future point in time (the furthest recorded point in time for us).
The formula to find the terminal value looks like this:
TV = (FCFn * (1 + g)) / (WACC - g)
Note
At this point, the model is assuming a perpetual growth rate of 2.5%.
To compute the Terminal Value in Authoring:
- Use
PLUSto add a constant of 1 to the perpetual growth rate. - Use
MULTIPLYto multiply the rounded free cash flow value from the furthest projected year by the result of the previousPLUSoperation. - Use
ROUNDonce more to the nearest 2 decimal places. - Use
DIVIDEto divide that result by WACC.
The result is the Terminal Value.
Step 3: Discounting the Terminal Value
With our Terminal Value in place, we are ready for the next step: discounting the terminal value. The formula looks like this:
Discounted_TV=TV/((1 + WACC) ** n)
Note
For WACC, it could also be acceptable to use an arbitrary flat Discount Rate of 8%.
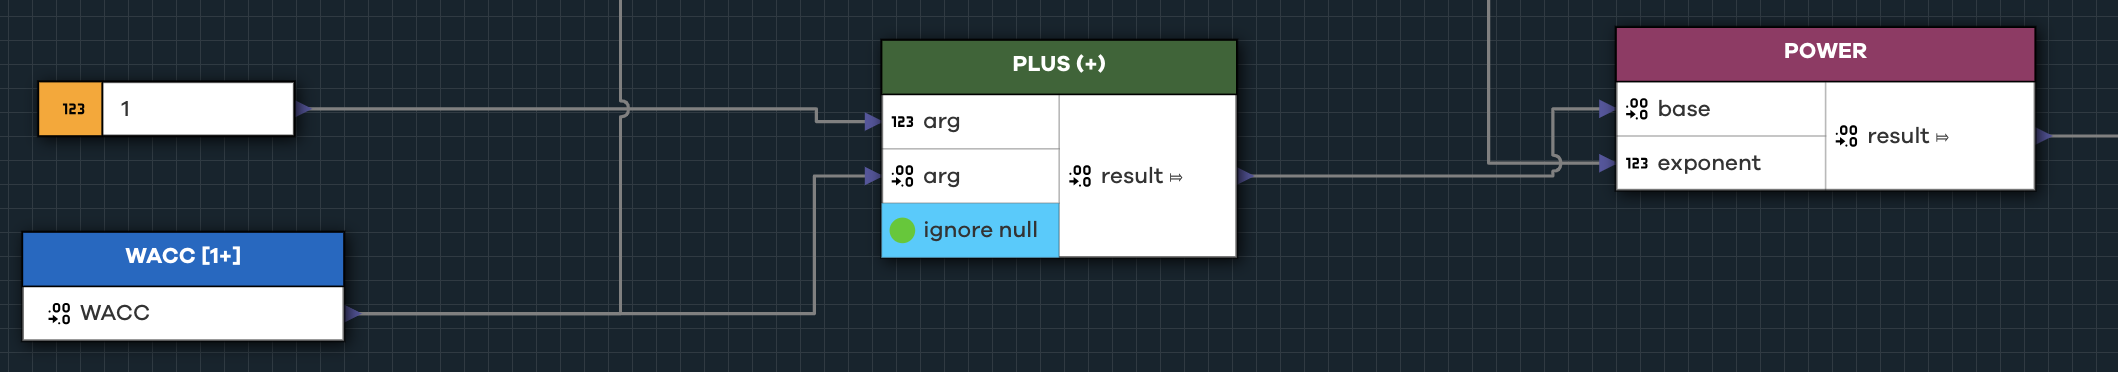
- Use
PLUSto add one to the WACC value. - Use
POWER, where the exponent is the value from the earlierCOUNToperation. - Use
DIVIDEto divide the Terminal Value by that result.
In Authoring, we take the Terminal Value we just generated and use DIVIDE by one plus the WACC to the power of n. Here, n is the number of years we want to project into the future prior to calculating the TV (we used a value of 5).
Step 4: Calculating the Company's Intrinsic Value
We are now ready to calculate the company's intrinsic value. This number will give us a solid comparison point for determining the worth of the asset, now and into the future under a 2.5% growth rate.
The formula for intrinsic value looks like this:
IT = DTV + (cash_and_equiv - total_debt)
To calculate the intrinsic value in Authoring:
- Use
PLUSto add the Discounted Terminal Value to the sum of all discounted cash flows from the previous years. - Use
PLUSto add that result to the cash and equivalents value we pulled from the ticker data. - Use
MINUSto subtract the total debt from the previous value to account for adjustments. - Use
DIVIDEto divide that result by the number of outstanding shares, a metric we pulled from the ticker data.
This formula gets us to the stock's intrinsic value and completes our DCF model.
Tying the Model Together
How can we use this model?
We can start to pose interesting scenarios based on the output Authoring gives us. For example, if we want to earn 8% on the stock, we know the price we should pay given the stock's intrinsic value. Further, DCF can be part of a larger model that takes many other factors into account. Combined with the Graham Dodd model, and others like Dividend Discount Models, we can form a rich picture of whether a stock is over- or undervalued.
In Workstation, we can build collections of undervalued assets by day or by month to track changes to them over time. We can compile these collections into detailed financial reports, including outside commentary in rich text (such as financial or market reports). Then, we can package everything in a single easy-to read report and share as needed.
Cogynt works best when processing live data signals from sources actively updating. The stock market is an ideal use case to apply any financial model your organization deems best suited to valuation. DCF is only one component in solving the complex problems that valuation presents.