Building the Student Retention Model
Building this model in Authoring requires several small computations to do the comparison work in level one. These computations help sort the student pool into initial qualifiers, flagging any students who meet certain conditions and assigning them an Issues label.
As the model ascends the hierarchy, it matches by student ID numbers to test for which students meet which conditions. The pattern outputs levels two and three to Workstation. The separate risk levels can help educators focus the appropriate attention to the highest risk students.
Level One Patterns
Level one is comprises four patterns:
- Excessive Absences
- Poverty Conditions May Exist
- Behavioral Issues
- Low Test Scores
Level one patterns always output data relevant to the pattern, assign an issue related to the event pattern, and record the student's:
- County code
- Gender
- Parental level of education
- Student ID
Utilizing Lexicons
Lexicons are most useful for categorizing output based on a subset of possible strings.
In this case, a lexicon holds all county codes where the child poverty rate is higher than 15%. The model uses the county code lexicon to filter all results so the poverty calculation only looks at candidates from these counties.
Using the lexmatch function might help improve this model. This dataset can expand to include a number of possible reasons for disciplinary action (such as disruption, violence, drugs, etc.). Lexicons can match for specific disciplinary issues, excluding lesser offenses or assigning them lower risk.
Configuring Risk
This model includes weighted risk that increases depending on the number of matches present. The following risk values were assigned in the lowest levels:
- Excessive Absences: .3
- Possible Poverty Conditions: .1 (While a strong indicator, there is not enough data to definitively conclude these conditions exist.)
- Behavior Risk: .4
- Low Test Scores: .4
With these values, administrators and analysts can focus on risk scores higher than 60 or even 65 to focus on students who may meet more than one risk condition.
Event notifications enhance the Workstation experience. Administrators can get notifications about students who present the highest risk. Notifications can even tag specific administrators who are best equipped to assist with each risk type. Notifications also help color code and add icons to events to make them stand out.
The Excessive Absences Pattern
This pattern compares two values in the Number of Absences schema. One or more absences during the first 30 days is considered excessive if the student also had eight or more absences in the last semester.
Two greater than comparison functions can be used to compare with constant integers. Using AND checks whether both conditions are true. The result (true or false) is then compared with the constant boolean result true. If the two equal one another, it's a match.
In the output calculation, the model introduces labeling Issues. Issues is a string array, meaning it can contain more than one string (to assign a student more than one issue). Use toArray to convert a string constant called "Excessive Absences". The output should be able to fit into the string array.
Poverty Conditions May Exist
Before beginning calculations, filter the event pattern for Socioeconomic Conditions by county codes that contain high child poverty levels. After creating the event pattern node, and adding the input event, right-click the event and select Edit Input Event Type.
Scroll down to the Filter field and select Lexicon as the Type.
In the filter field, select the field to compare (the example lexicon is named county_code). Click the book icon in the lexicon node field, and select the root of the node tree containing the county codes.
All results are now filtered to only county codes with a high degree of child poverty.
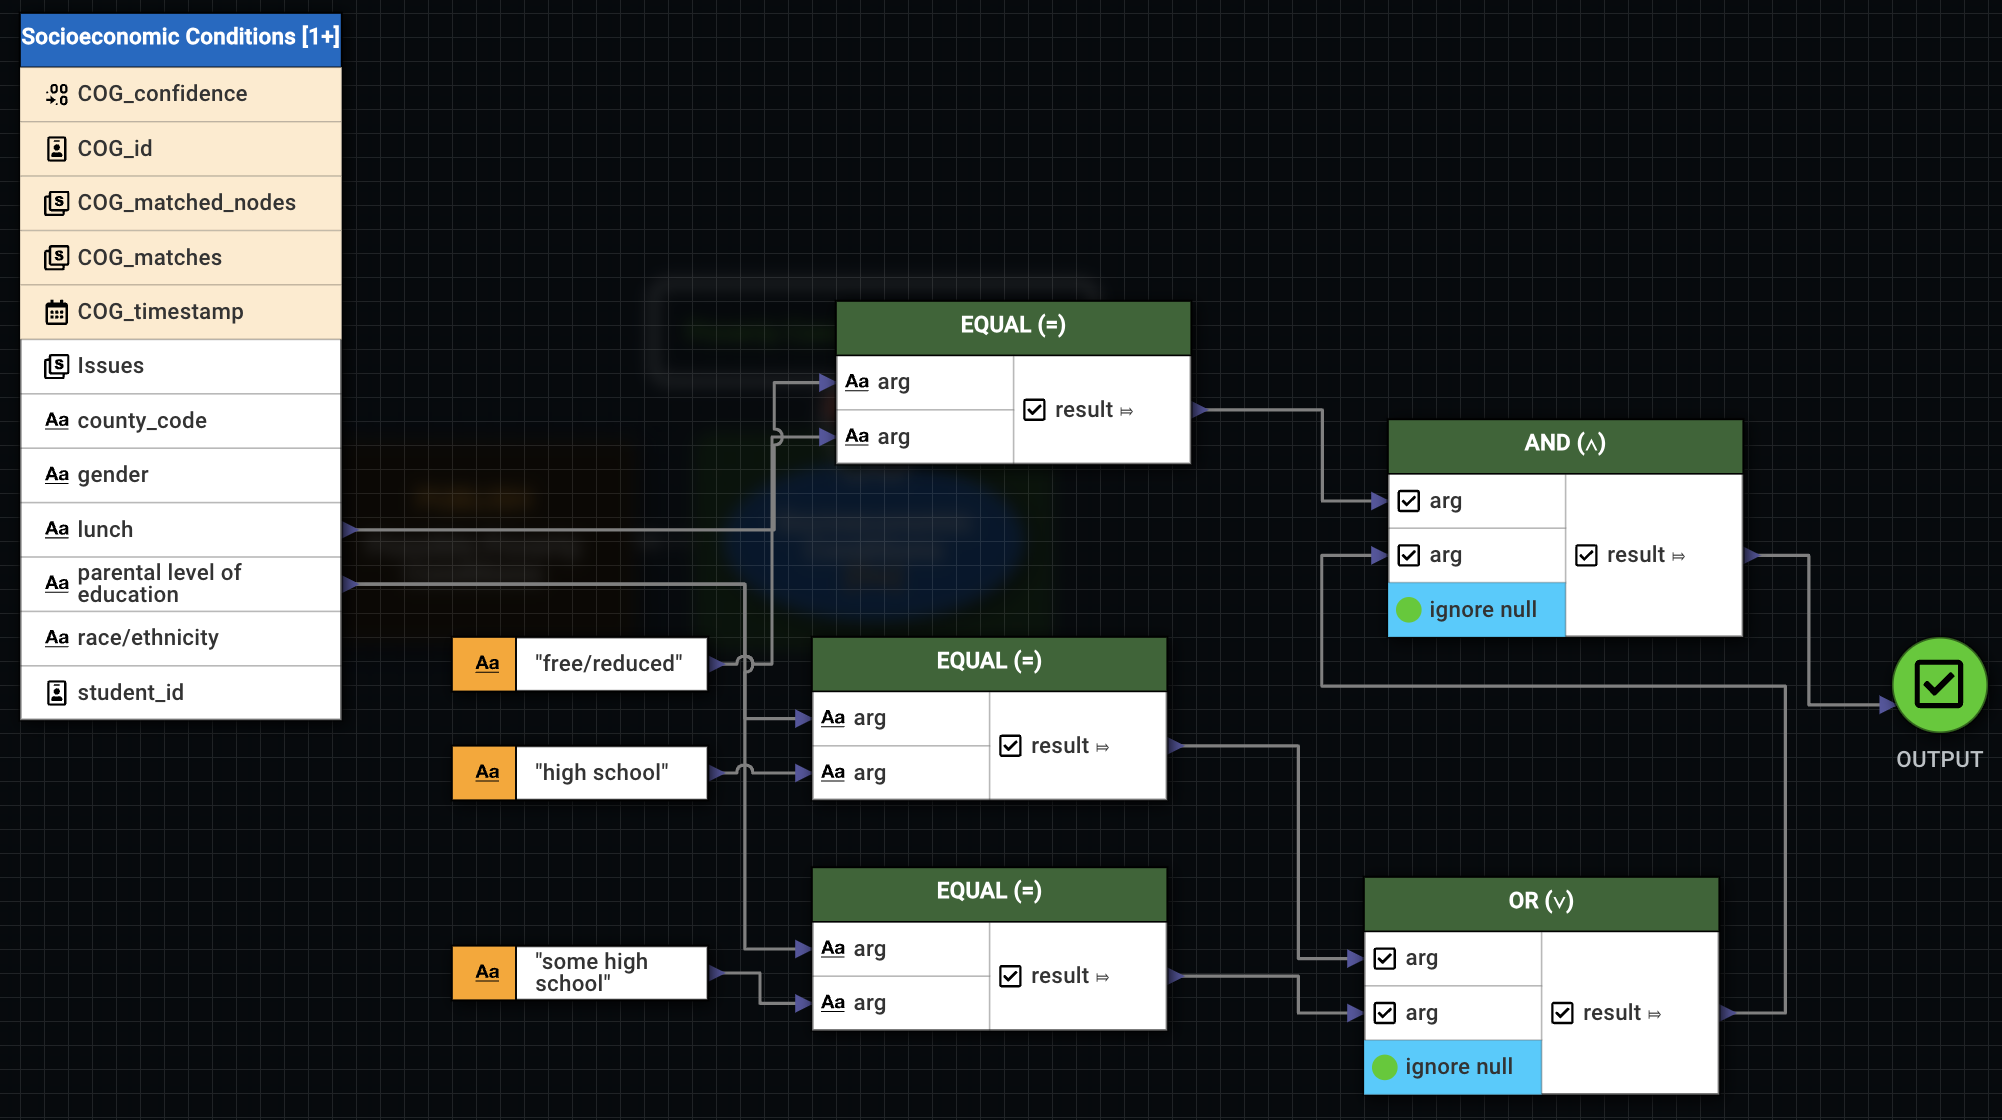
This calculation has two layers to it. In the first layer, use EQUAL to compare with constant values. The constants to compare are:
- Whether lunch is free/reduced.
- Whether parental education level is no higher than a high school diploma.
With the results output, first use OR to check the parental level of education. If either "high school" or "some high school" was output, it's a match. True or false, the output can be used with AND to check the students status. If the student's lunch is free/reduced, and if the parental level of education is no higher than high school, the result is true.
Assign the Issues label with a constant string like "Poverty Conditions May Exist."
The Behavioral Issues Pattern
Suspensions lasting more than five days are considered a serious disciplinary action. This model targets students with greater than or equal to three absences to give administrators a higher chance of intervening before the issue becomes too great. In this case, the model only needs to compare the field for exclusionary_discipline_days_served against a constant value of three.
If the result is equal to or greater than, the model will assign an Issues label to it and escalate to the next highest level.
The Low Test Scores Pattern
For this pattern, use the data schema for test scores. The calculation is as follows:
- Take the
avgof math, reading, and writing scores. - Compare that value to see if it is less than a constant integer of 65. Output the result.
- Compare that result to a boolean constant of true. If the two are equal, there is a match.
Assign the Issues label with something like "Low Test Scores."
Level Two Patterns
As long as the model carries student IDs upward from the lower level patterns, comparisons are easy.
The second level includes optional conditions, where students can meet some or all conditions and are assigned risk values accordingly. Therefore, change the min value in the relevant event type to 0.
For example, a Behavior Risk is triggered if a student has Behavior Issues. But it can also include students who have this condition as well as excessive absences, low test scores, poverty conditions, or some combination of these conditions.
Ensure each event pattern node used in student_id matching is present in the output event calculation. Carry only the relevant fields from each pattern into the output event. Solve this by connecting the input and output event fields for all required event patterns in each match.
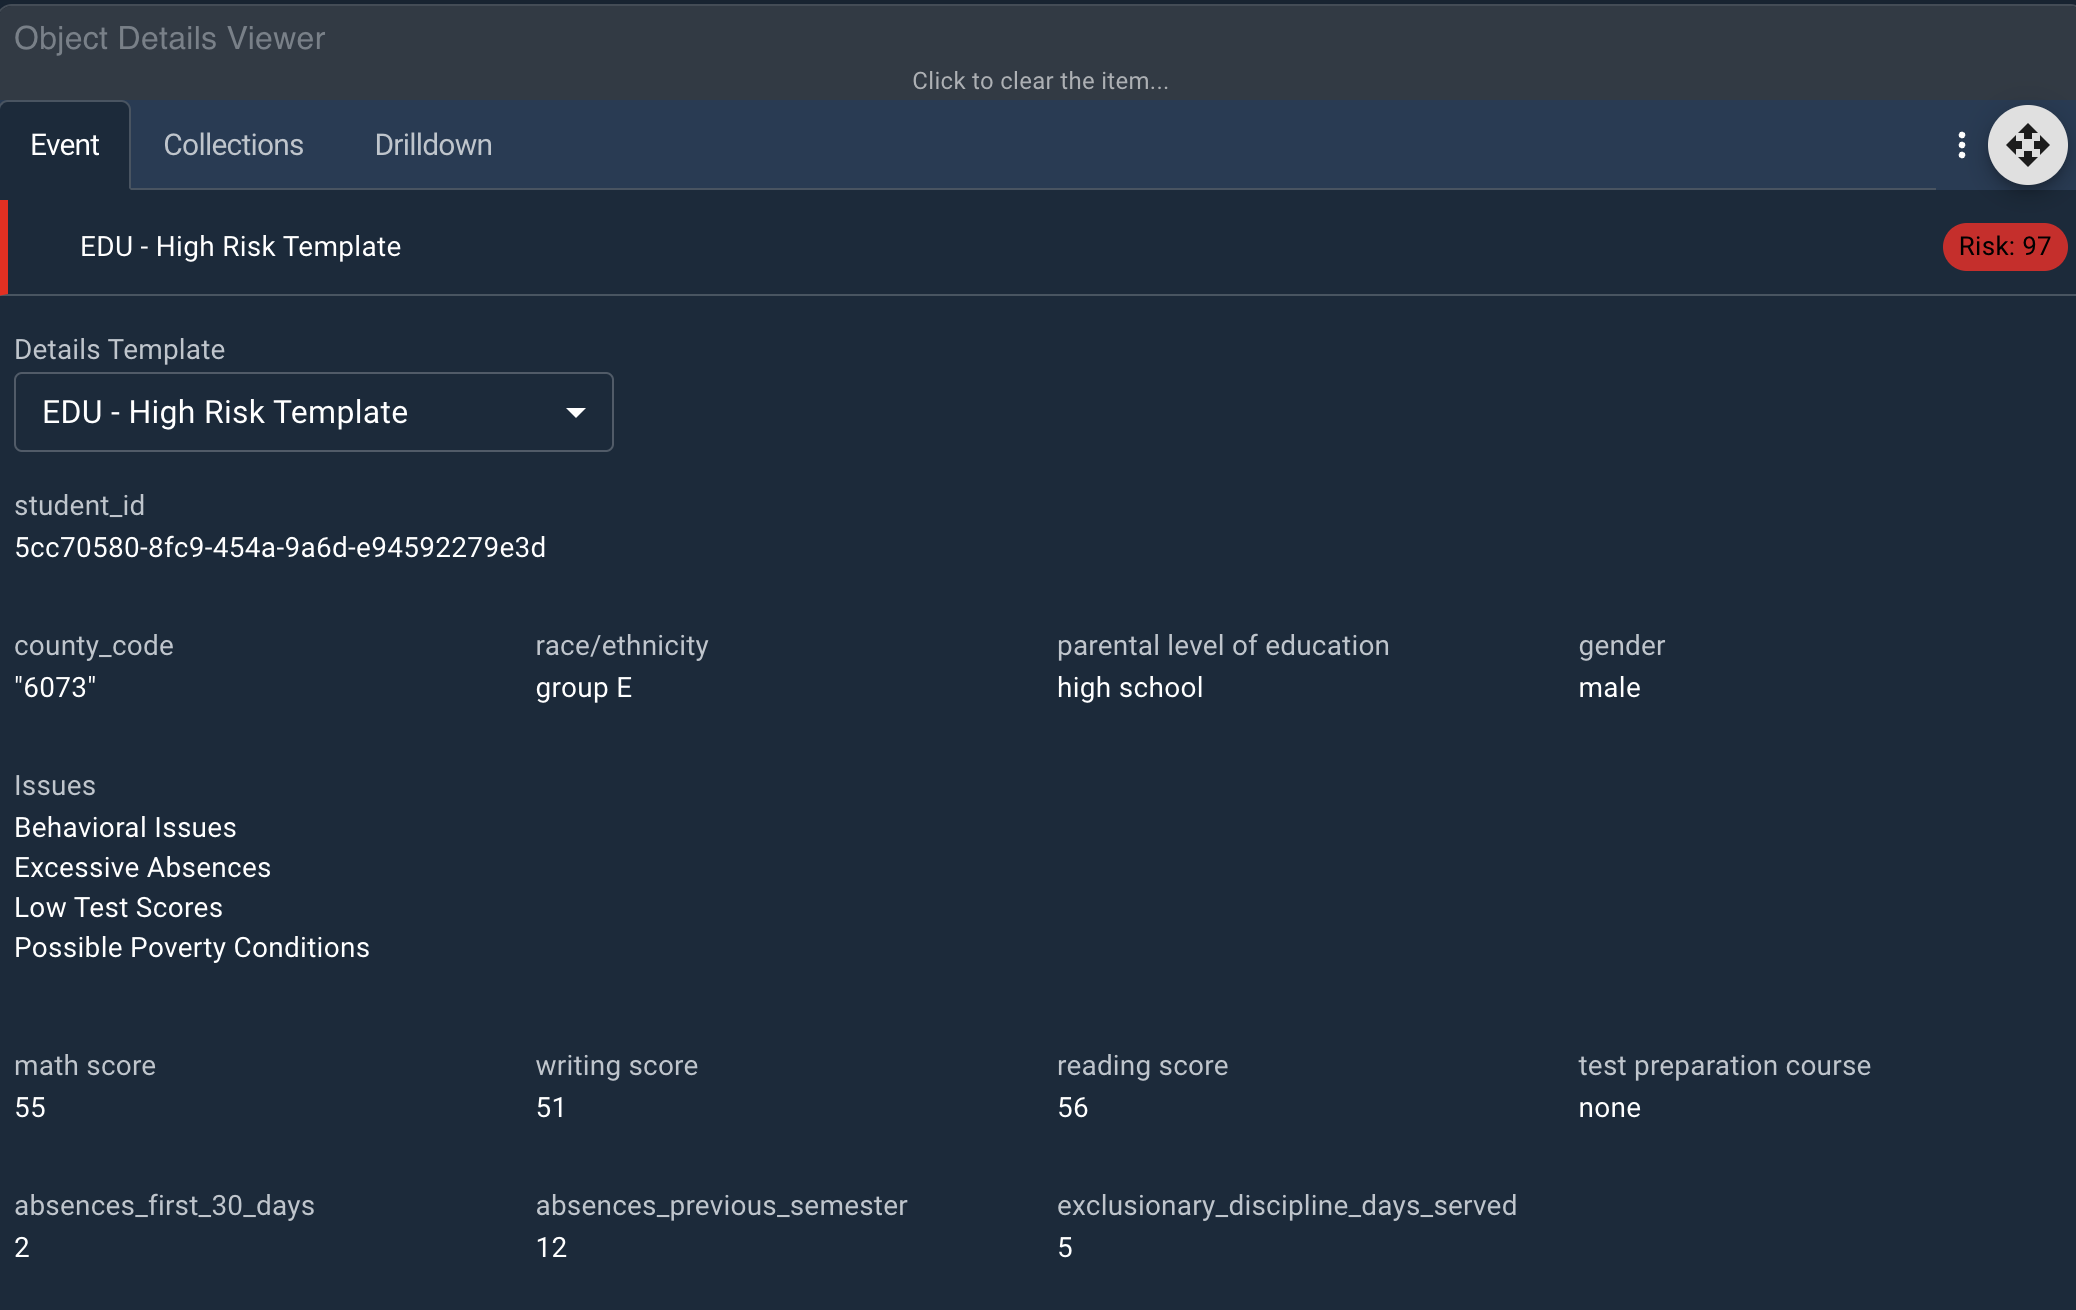
When the analyst views these events in Workstation, they only see data fields relevant to the risks each student faces.
With the combine function in each output event node, the model can feed each of the Issues assigned in the low-level patterns into a list that is output with the event. Simply drag the issues field from each event pattern node into the combine function.
Level Three Pattern
The High Risk pattern represents students who meet at least two, possibly three of the level two conditions. An education expert would likely have more nuanced criteria, but this model has chosen to highlight students who have both behavior and academic risks. Absences are considered optional condtions, but these thresholds are adjustable.
Deploying the Model
When deploying the model, which should be done throughout the process of building these nodes, publish only the event patterns for levels two and three. Publish the lower levels during troubleshooting phases.
Once the model is deployed, ingest the data in Workstation and find the at-risk students.
Next Steps
With the model built, the next step is to view its results in Workstation.