Using HCEP and Cogynt to Detect Student Failure Rates
According to the National Academies Press, a number of indicators factor into a student dropping out of school. Yet dropping out is not a decision made in the moment. It happens as part of a gradual disengagement, with early problems building and compounding over time.
Because students who achieve higher education tend to live happier and healthier lives, keeping them engaged with learning is critical to their success.
While poverty and socioeconomic status are important indicators, other leading indicators include:
- Low Test Scores
- Behavior Issues
- Attendance Risks
Combined, these risks offer many ways to offer targeted help to students. Intervention at the earliest possible time, when warning signs first appear, is critical for long term success.
To help reduce dropout rates, Cogynt has developed a model to spot students who show signs of dropout risk. This article covers the model's methods and the organization of its dataset. Jump ahead to see how the model was built or see the results in Workstation.
What the Model Identifies
The goal of this model is to decide when or whether students are on a failure trajectory by the end of that student's semester in a fictional school.
The model compares data with some constant limits, and makes a risk weighted judgment that decides which student ID numbers are at risk for which issues.
Schools can intervene using these findings to offer targeted support specifically to where a student is failing. This model is a broad overview, but the concepts are easy to adapt to real life educational use cases.
Organizing The Dataset
The data used is a modified version of this graduation rate dataset from Kaggle. The following fields were added:
- Student IDs.
- Mock attendance.
- Mock socioeconomic data (such as assigning students a county code).
- Fabricated absence data.
Test scores and performance over time are not factored into this data, which is instead presented here like a snapshot.
The data set uses schemas named after each of the low level patterns, and lexicons to help simplify detection of some outputs.
The data consists of:
| Field | Description |
|---|---|
| Gender | The student's identified gender. |
| Race/Ethnicity | For anonymity, groups are used. Possible groups are A-E. |
| Parental Education Level | The highest education level achieved by a parent. |
| Lunch | Identifies whether a student is on a free/reduced lunch program. |
| Test Preparation | Identifies students who have completed a course in test preparation. |
| Math, Reading, and Writing Scores | The recorded scores of the most recent major exams in each subject. |
| Student ID | The student's system-generated ID number. |
| County Code | Identifies the county the student resides in. |
| Exclusionary Discipline Days Served | The number of exclusionary discipline days served. Exclusionary discipline includes suspension/expulsion. |
| Absences in First 30 Days | The number of absences recorded during the first 30 days of instruction for the school year. |
| Absences Previous Semester | The number of absences recorded during the student's last semester. |
Data Schemas
The analyst is most concerned with the problem behaviors identified. Other factors may ultimately come into play upon engaging with the student, but giving proper support requires finding the indicators for risk.
This project uses one data source that has many fields not relevant to every pattern. Whether using one or many sources of data, data schemas will help separate values needed for use in specific patterns.
In this case, the following data schemas were used:
- Academic Records - Primarily tracks student test scores and academic related data.
- Attendance Records - Primarily tracks student's attendance and expulsions/suspensions.
- Behavior Records - Only tracks a student's expulsions/suspensions.
- Socioeconomic Records - Primarily tracks a student's socioeconomic data (such as parental education level and zip code).
- Student Records - Contains all data points in a single schema.
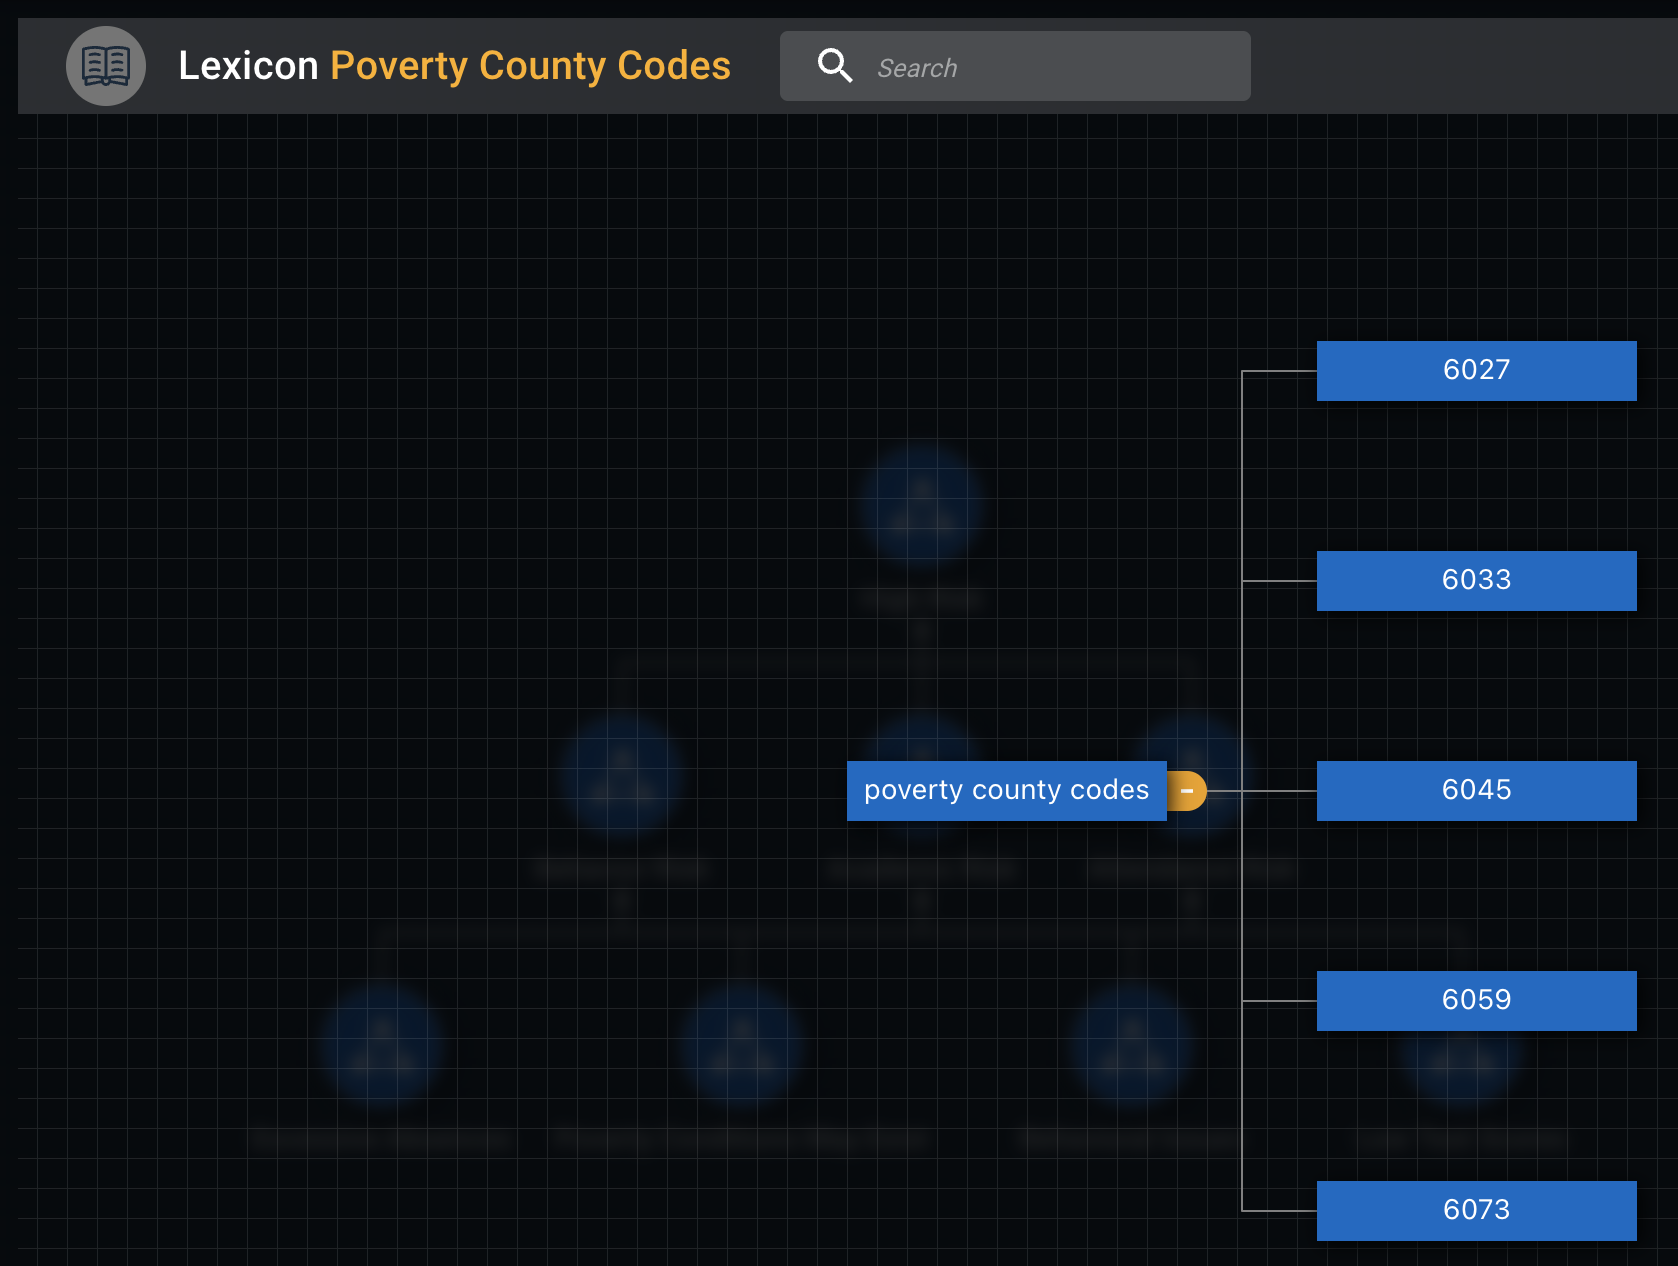
Lexicons
Lexicons are collections of terms, expressed visually as nodes in a tree. These words and their synonyms are arranged hierarchically, allowing for branches and sub-branches to further categorize words. Any of these nodes are selectable. The model uses the root node.
Key Indicators
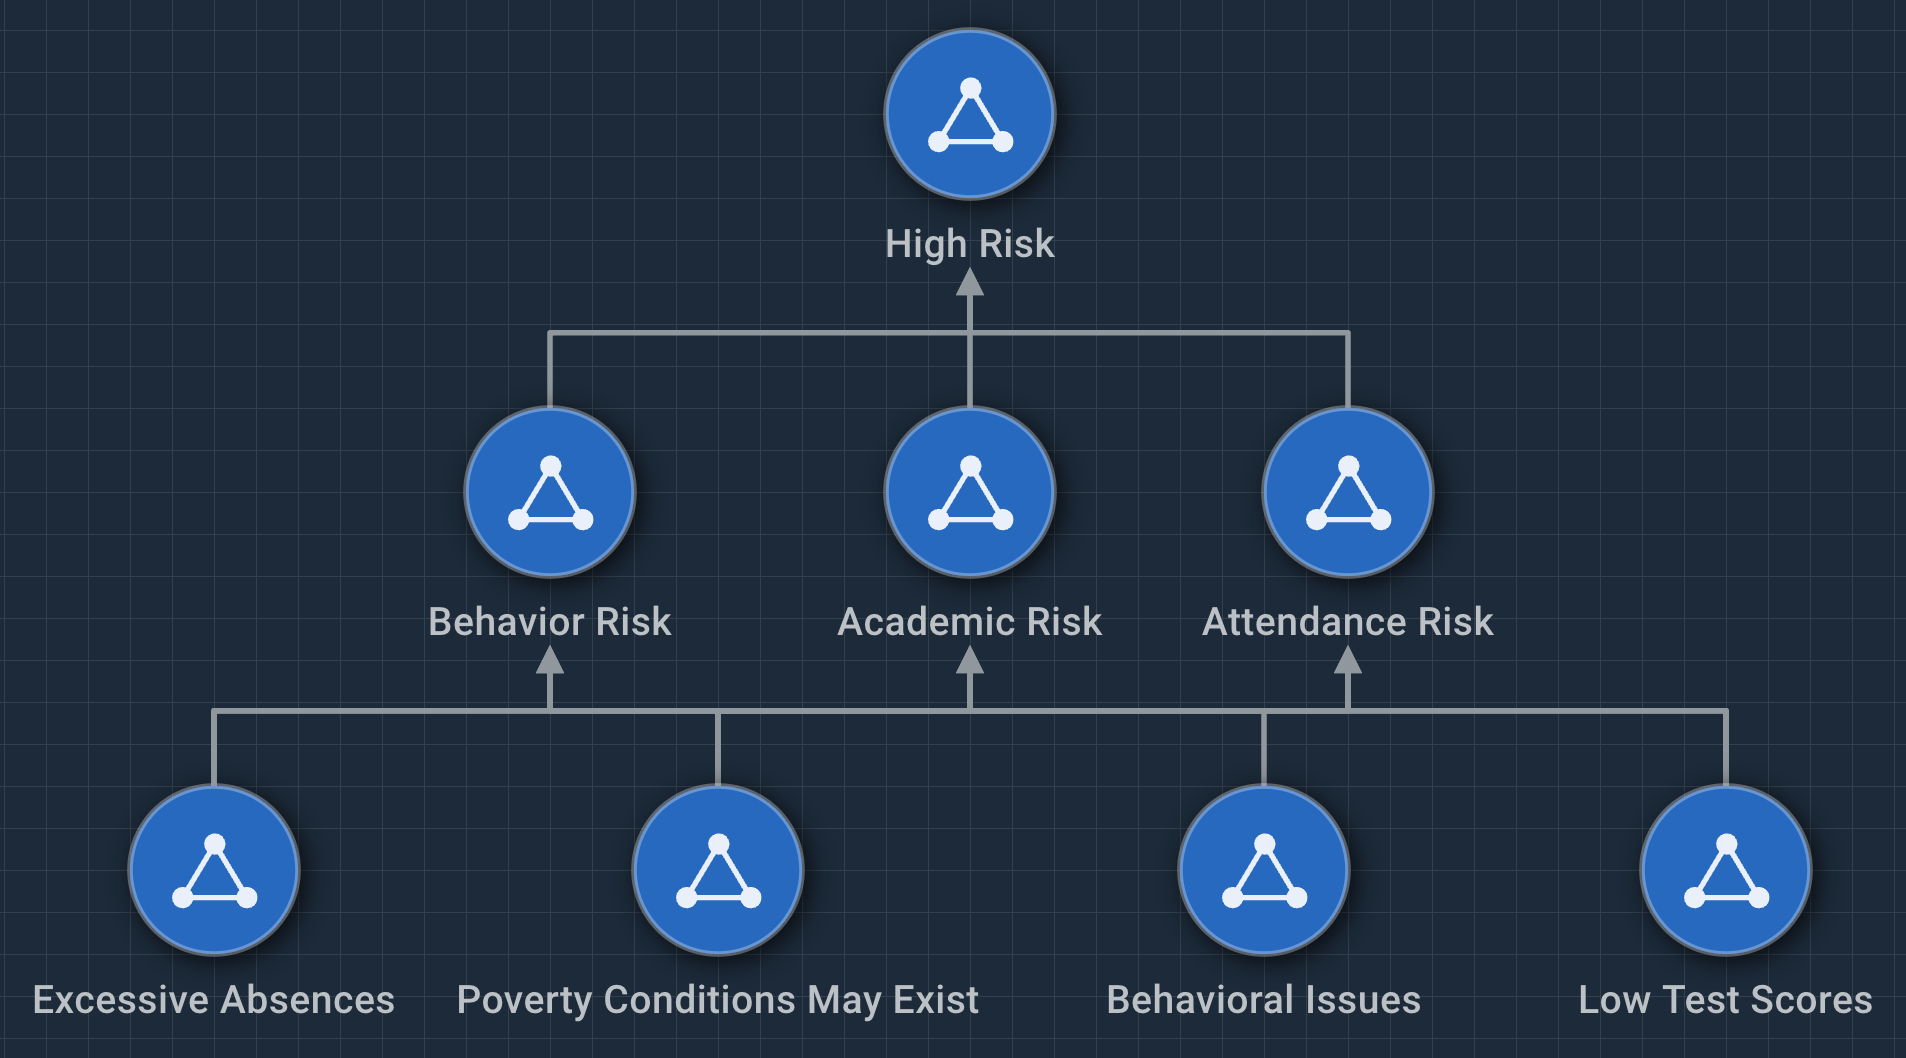
This model has three key indicators, and one high-risk indicator. To achieve this, the model builds from four lower level risk indicators.
Low-Level Indicators
The low level indicators flag students who meet specific criteria:
- Excessive absences are difficult to define and districts may have their own number to compare against. We also know that absences during the first 30 days matter. Attendance is considered a lower risk indicator.
- Behavioral issues occur when students face multi-day suspensions or expulsions. Trouble at home can be an indicator, but is difficult to measure. This behavior is a higher risk due to possible expulsion.
- Low test scores on their face would signal the most obvious sign that failure is imminent. But low test scores can be indicative of other issues at home that may contribute to behavior. This risk is assigned an appropriately higher risk score.
- Poverty conditions contribute to a turbulent home life and lack of focus in class. This pattern needs to combine indicators that may signal a student's socioeconomic standing. Because this is an imperfect measurement, it is assigned a modest risk.
Challenge: Can you sketch out a hierarchical decision tree for each of these conditions?
Mid-Level Indicators
Once you have computed the lower risk patterns, your student body is sorted by the conditions flagged.
The mid-level models use this sorting to match student ID numbers. If student IDs match between conditions, the student meets those conditions and the model can assign an appropriate risk score.
The mid-level conditions are:
- Behavioral risk students must have the behavior issues event, but also may have excessive absences, low test scores, and/or poverty conditions.
- Academic risk students must have low test scores, but also may have poverty conditions and/or excessive absences.
- Attendance risk students must have excessive absences, but may also have low test scores and/or poverty conditions.
These outputs are published in Workstation as events, categorizing specific students according to the risks they pose.
High-Risk Indicators
A student at high risk meets at least two conditions, namely behavior and academic risks.
The high risk values can be filtered for on the Workstation side with system notifications, sending each to the proper department based on risk level.
High-risk students represent those with the most immediate needs.
Next Steps
Now that you've seen an overview of this project, you can explore building the model yourself.