Building Workspaces in Cogynt Workstation
Cogynt Workstation offers both data visualization and tools for detailed data analysis. This work occurs within a workspace. A workspace usually comprises a variety of widgets.
For the final part of this exercise, you'll send the data from your deployment to Cogynt Workstation, then construct a workspace to visualize and analyze it.
All of the processes outlined on this page should be performed in Cogynt Workstation.
Ingesting Data into Workstation
When you first log in to Workstation, your workspace will be blank. This is because Workstation has no data to show yet.
The process by which Workstation accepts and processes data for display is called "ingesting." In this step, you'll direct Workstation to ingest your data.
To ingest your data into Workstation:
- At the top right of the Workstation homepage, click the Settings icon.
- In the left side drawer, click Data Ingestion. Note, this is the default location once you've clicked the Settings icon.
- Locate your data stream from the table of available data sources. (Following our example, the project to select is "Hello World" + your initials.)
- Click the three-dot menu and select Run to start data ingestion.
The ingestion status of your data is indicated by one of the following colors:
- Gray: Ingestion is not running.
- Green: Ingestion is running.
- Red: The selected topic does not exist.
If you suspend ingestion, you will no longer receive new messages from the suspended data stream. However, the stream's historical data will remain available in Workstation.
To receive real-time updates from a data stream, keep ingestion running.
Now that Workstation knows where to find your data and has begun to process it, the final step in this exercise is to create a workspace to visualize and work with the data.
Creating Workspaces
For the final part of this exercise, you'll construct a workspace to see your data in action. You'll start by creating the workspace itself. Then you'll customize it by adding several widgets to it, and configure the widgets to show your data.
To create your workspace:
- At the top of the Workstation homepage, click Home.
- In the top right side of the home page, click + New Workspace.
- In the Add New Workspace dialog:
- In the Name field, type a name for the workspace. (For this exercise, "Hello World" is recommended.)
- In the Description field, type a description for the workspace if desired.
- Click Create.
With the workspace created, the next step is to add widgets to it. For this exercise, you'll use three specific widgets to visualize your data set.
To add the widgets to your workspace:
- Within the workspace you created, in the left navigation pane, click Add Widgets.
- In the Add Widgets to the Workspace modal, click ADD beside the following widgets:
- Object Details Viewer
- Events Stream
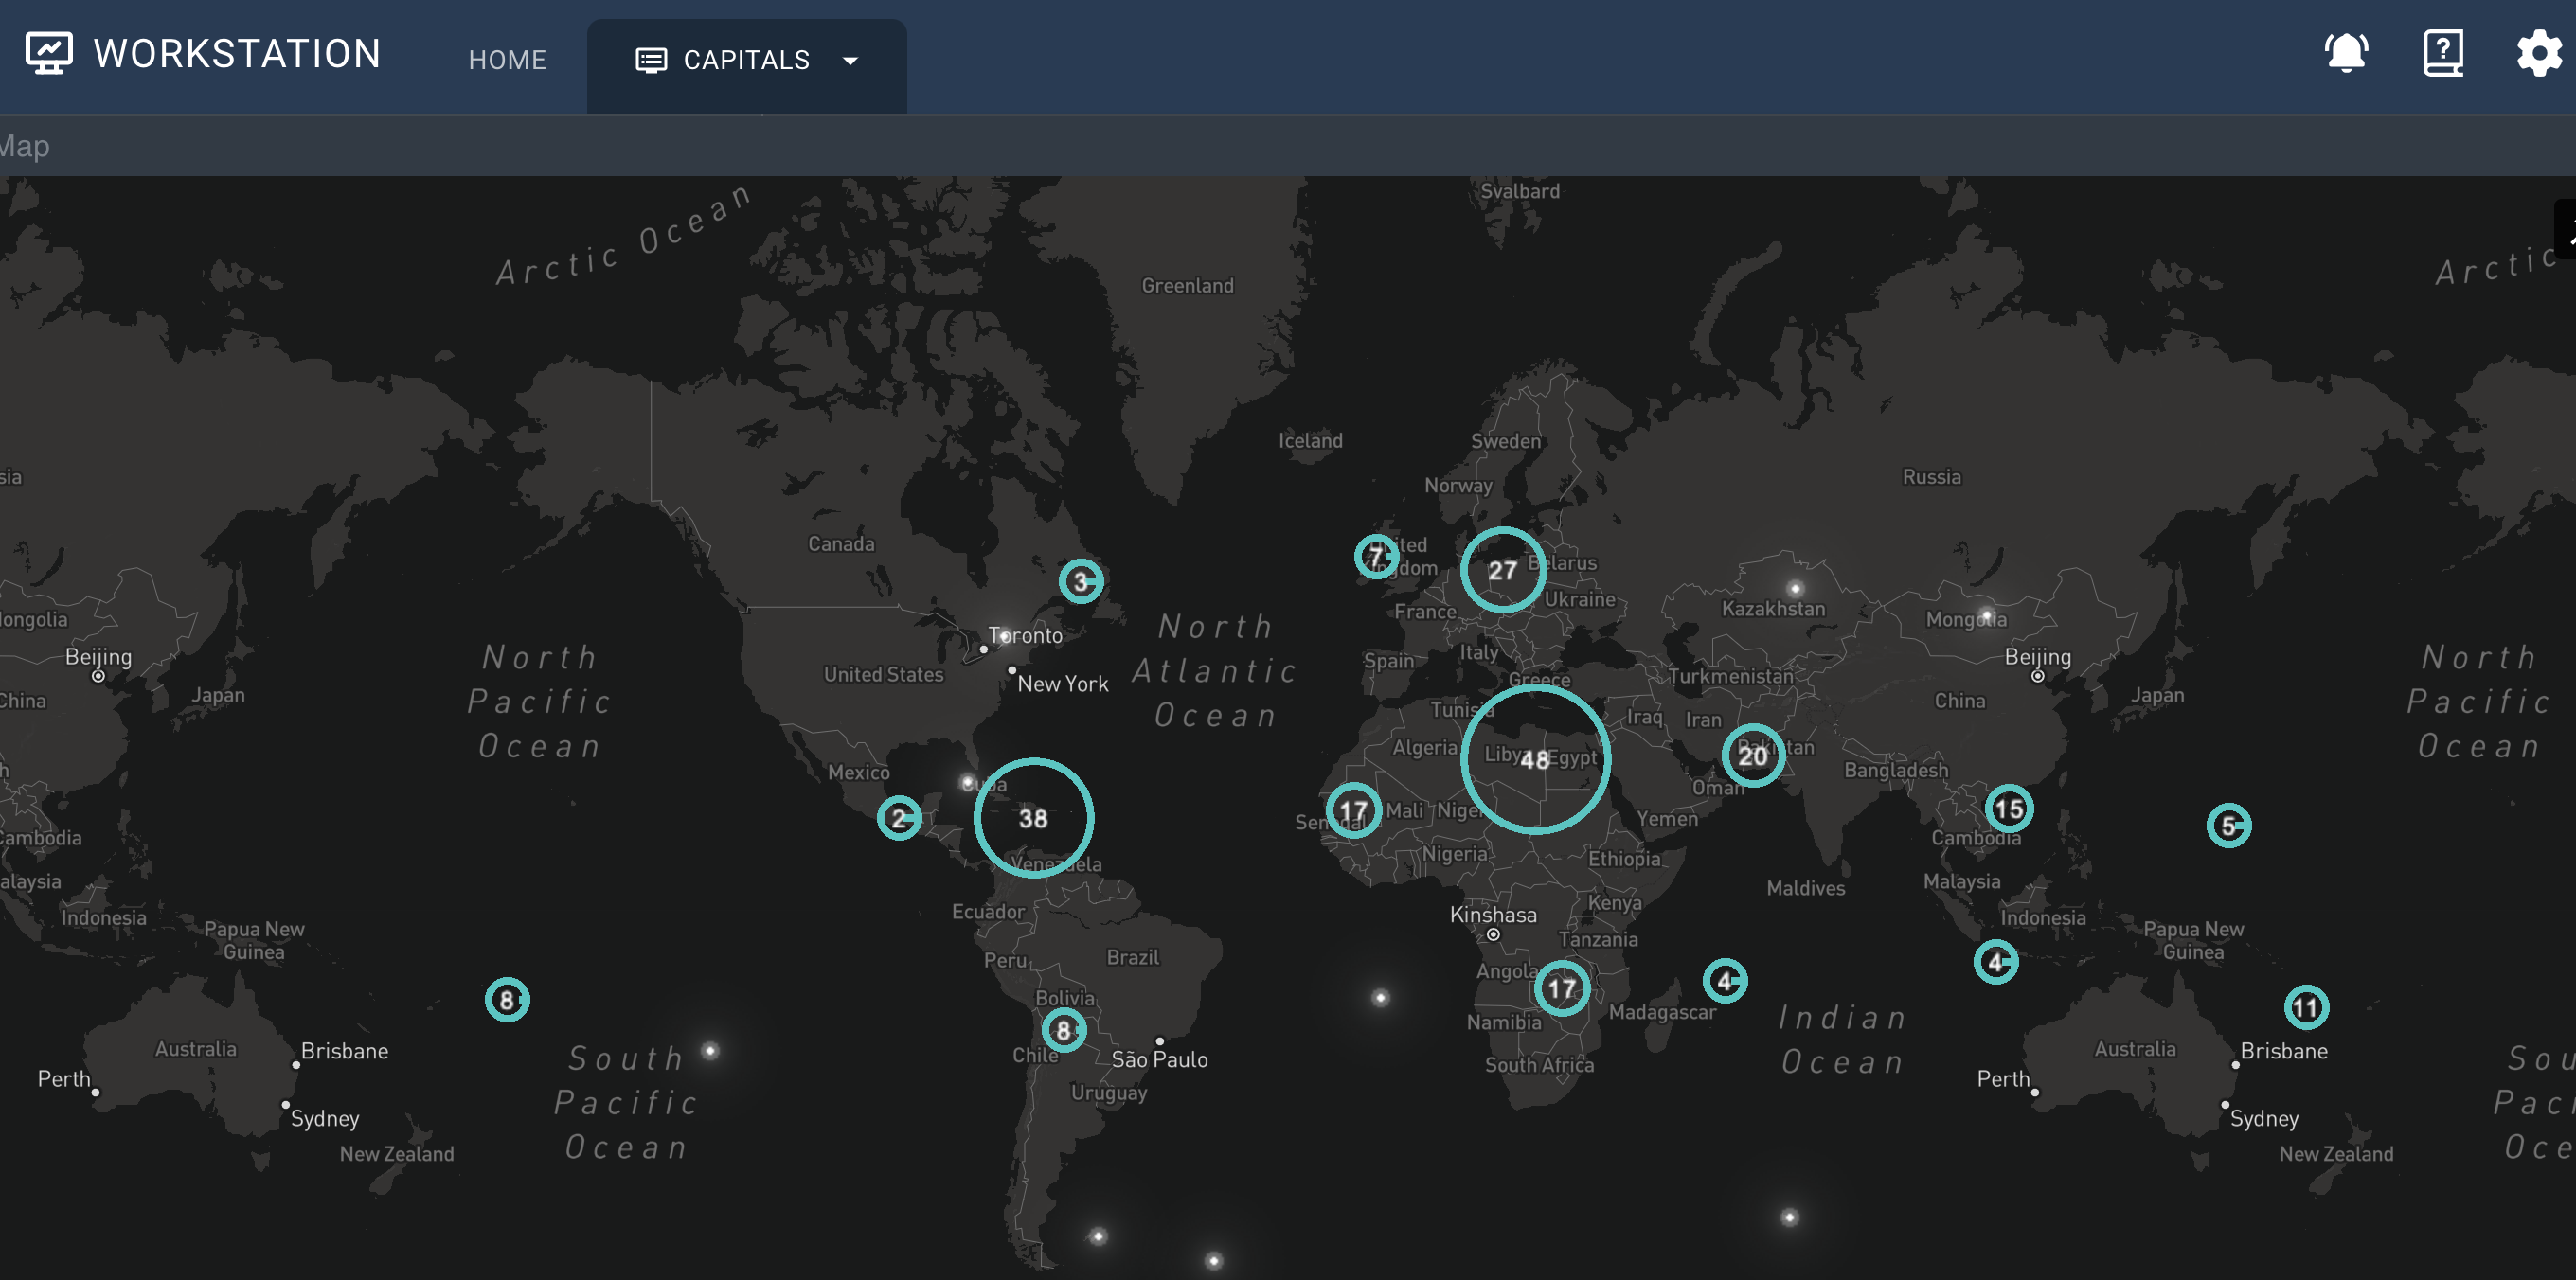
- Interactive Map
- In the workspace, click and drag a widget's top bar to reposition it as desired. Click and drag the bottom-right corner of each widget to resize them as needed.
All that remains now is to configure the widgets:
- In the Events Stream widget, type the name of your project in the Search bar. (Following our example, "Hello World" + your initials.) This gives you a set of events to work with.
- Click and drag an event from the Events Stream widget to the Object Details Viewer widget. This allows you to view the event's data.
- Click and drag the target icon from the upper-right of the Event Stream widget to the Interactive Map widget. This plots all the events from the stream on the map.
- In the Interactive Map widget, at the bottom-right of the screen, click the + and - buttons to zoom in and out of the map.
Now you're free to experiment. Inspect individual events in the Object Details Viewer widget, or manipulate the Interactive Map widget's zoom features until you see all the capitals from your data set at a glance.